<< Chapter < Page Chapter >> Page >

Introduction

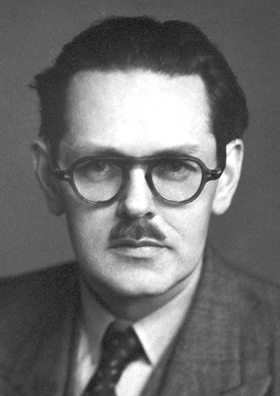
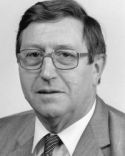
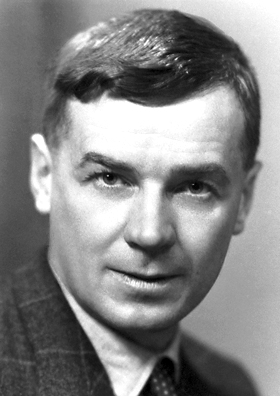
Archer J.P. Martin ( [link] ) and Anthony T. James ( [link] ) introduced liquid–gas partition chromatography in 1950 at the meeting of the Biochemical Society held in London, a few months before submitting three fundamental papers to the Biochemical Journal . It was this work that provided the foundation for the development of gas chromatography. In fact, Martin envisioned gas chromatography almost ten years before, while working with R. L. M. Synge ( [link] ) on partition chromatography. Martin and Synge, who were awarded the chemistry Nobel prize in 1941, suggested that separation of volatile compounds could be achieved by using a vapor as the mobile phase instead of a liquid.

British chemist Archer J. P. Martin, FRS (1910-2002) shared the Nobel Prize in 1952 for partition chromatography.
British chemist Anthony T. James (1922-2006).
British biochemist Richard L. M. Synge, FRS (1914-1994) shared the Nobel Prize in 1952 for partition chromatography.

Gas chromatography quickly gained general acceptance because it was introduced at the time when improved analytical controls were required in the petrochemical industries, and new techniques were needed in order to overcome the limitations of old laboratory methods. Nowadays, gas chromatography is a mature technique, widely used worldwide for the analysis of almost every type of organic compound, even those that are not volatile in their original state but can be converted to volatile derivatives.

The chromatographic process

Gas chromatography is a separation technique in which the components of a sample partition between two phases:

  1. The stationary phase.
  2. The mobile gas phase.

According to the state of the stationary phase, gas chromatography can be classified in gas-solid chromatography (GSC), where the stationary phase is a solid, and gas-liquid chromatography (GLC) that uses a liquid as stationary phase. GLC is to a great extent more widely used than GSC.

During a GC separation, the sample is vaporized and carried by the mobile gas phase (i.e., the carrier gas) through the column. Separation of the different components is achieved based on their relative vapor pressure and affinities for the stationary phase. The affinity of a substance towards the stationary phase can be described in chemical terms as an equilibrium constant called the distribution constant K c , also known as the partition coefficient, [link] , where [A] s is the concentration of compound A in the stationary phase and [A] m is the concentration of compound A in the stationary phase.

The distribution constant (K c ) controls the movement of the different compounds through the column, therefore differences in the distribution constant allow for the chromatographic separation. [link] shows a schematic representation of the chromatographic process. K c is temperature dependent, and also depends on the chemical nature of the stationary phase. Thus, temperature can be used as a way to improve the separation of different compounds through the column, or a different stationary phase.

Questions & Answers

how do you get the 2/50
Abba Reply
number of sport play by 50 student construct discrete data
Aminu Reply
width of the frangebany leaves on how to write a introduction
Theresa Reply
Solve the mean of variance
Veronica Reply
Step 1: Find the mean. To find the mean, add up all the scores, then divide them by the number of scores. ... Step 2: Find each score's deviation from the mean. ... Step 3: Square each deviation from the mean. ... Step 4: Find the sum of squares. ... Step 5: Divide the sum of squares by n – 1 or N.
kenneth
what is error
Yakuba Reply
Is mistake done to something
Vutshila
Hy
anas
hy
What is the life teble
anas
hy
Jibrin
statistics is the analyzing of data
Tajudeen Reply
what is statics?
Zelalem Reply
how do you calculate mean
Gloria Reply
diveving the sum if all values
Shaynaynay
let A1,A2 and A3 events be independent,show that (A1)^c, (A2)^c and (A3)^c are independent?
Fisaye Reply
what is statistics
Akhisani Reply
data collected all over the world
Shaynaynay
construct a less than and more than table
Imad Reply
The sample of 16 students is taken. The average age in the sample was 22 years with astandard deviation of 6 years. Construct a 95% confidence interval for the age of the population.
Aschalew Reply
Bhartdarshan' is an internet-based travel agency wherein customer can see videos of the cities they plant to visit. The number of hits daily is a normally distributed random variable with a mean of 10,000 and a standard deviation of 2,400 a. what is the probability of getting more than 12,000 hits? b. what is the probability of getting fewer than 9,000 hits?
Akshay Reply
Bhartdarshan'is an internet-based travel agency wherein customer can see videos of the cities they plan to visit. The number of hits daily is a normally distributed random variable with a mean of 10,000 and a standard deviation of 2,400. a. What is the probability of getting more than 12,000 hits
Akshay
1
Bright
Sorry i want to learn more about this question
Bright
Someone help
Bright
a= 0.20233 b=0.3384
Sufiyan
a
Shaynaynay
How do I interpret level of significance?
Mohd Reply
It depends on your business problem or in Machine Learning you could use ROC- AUC cruve to decide the threshold value
Shivam
how skewness and kurtosis are used in statistics
Owen Reply
yes what is it
Taneeya
Got questions? Join the online conversation and get instant answers!
Jobilize.com Reply

Get Jobilize Job Search Mobile App in your pocket Now!

Get it on Google Play Download on the App Store Now


Source:  OpenStax, Physical methods in chemistry and nano science. OpenStax CNX. May 05, 2015 Download for free at http://legacy.cnx.org/content/col10699/1.21
Google Play and the Google Play logo are trademarks of Google Inc.

Notification Switch

Would you like to follow the 'Physical methods in chemistry and nano science' conversation and receive update notifications?

Ask