<< Chapter < Page Chapter >> Page >

Introduction

One of the problems associated with testing a new unproven photovoltaic material or cell design is that significant processing required in order to create a fully functioning solar cell. If it is desired to screen a wide range of materials or synthetic conditions it can be time consuming (and costly of research funds) to prepare fully functioning devices. In addition, the success of each individual cell may be more dependent on fabrication steps not associated with the variations under study. For example, lithography and metallization could cause more variability than the parameters of the materials synthesis. Thus, the result could be to give no useful information as to the viability of each material under study, or even worse a false indication of research direction.

So-called quick and dirty qualitative measurements can be employed to assess not only the relative photoresponse of new absorber layer materials, but also the relative power output of photovoltaic devices. The measurement procedure can provide a simple, inexpensive and rapid evaluation of cell materials and structures that can help guide the development of new materials for solar cell applications.

Equipment needs

Everything needed for the measurements can be purchased at a local electronics store and a hardware or big box store. Needed items are:

  • Two handheld digital voltmeter with at least ±0.01 mV sensitivity (0.001 mV is better, of course).
  • A simple breadboard and associated wiring kit.
  • A selection of standard size and wattage resistors ( 1 / 8 - 1 Watt, 1 - 1000 ohms).
  • A selection of wire wound potentiometers (0 - 10 ohms; 0 - 100 ohms; 0 - 1000 ohms) if I-V tracing is desired.
  • A light source. This can be anything from a simple flood light to an old slide projector.
  • A small fan or other cooling device for “steady state” (i.e., for measurements that last more than a few seconds such as tracing an I-V curve).
  • 9 volt battery and holder or simple ac/dc low voltage power supply.

Measurement of the photo-response of an experimental solar cell

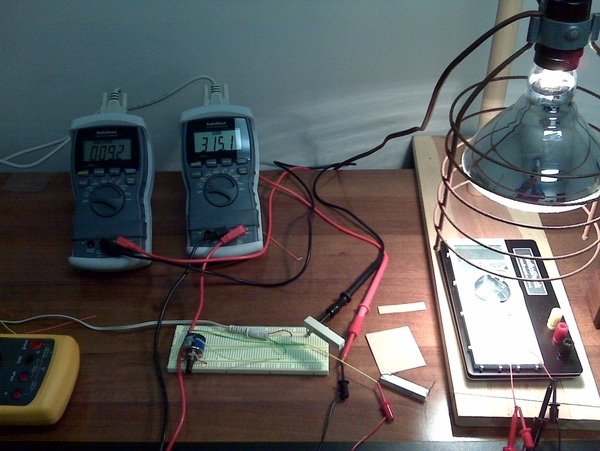
A qualitative measurement of a solar cell’s current-voltage (I-V) characteristics can be obtained using the simple circuit diagram illustrated in [link] . [link] shows an I-V test setup using a household flood lamp for the light source. A small fan sits to the right just out of the picture.

Simple circuit diagram for I-V measurement of a prototype solar cell.
Simple test apparatus for qualitative measurement of the current-voltage output from an experimental thin film solar cell.

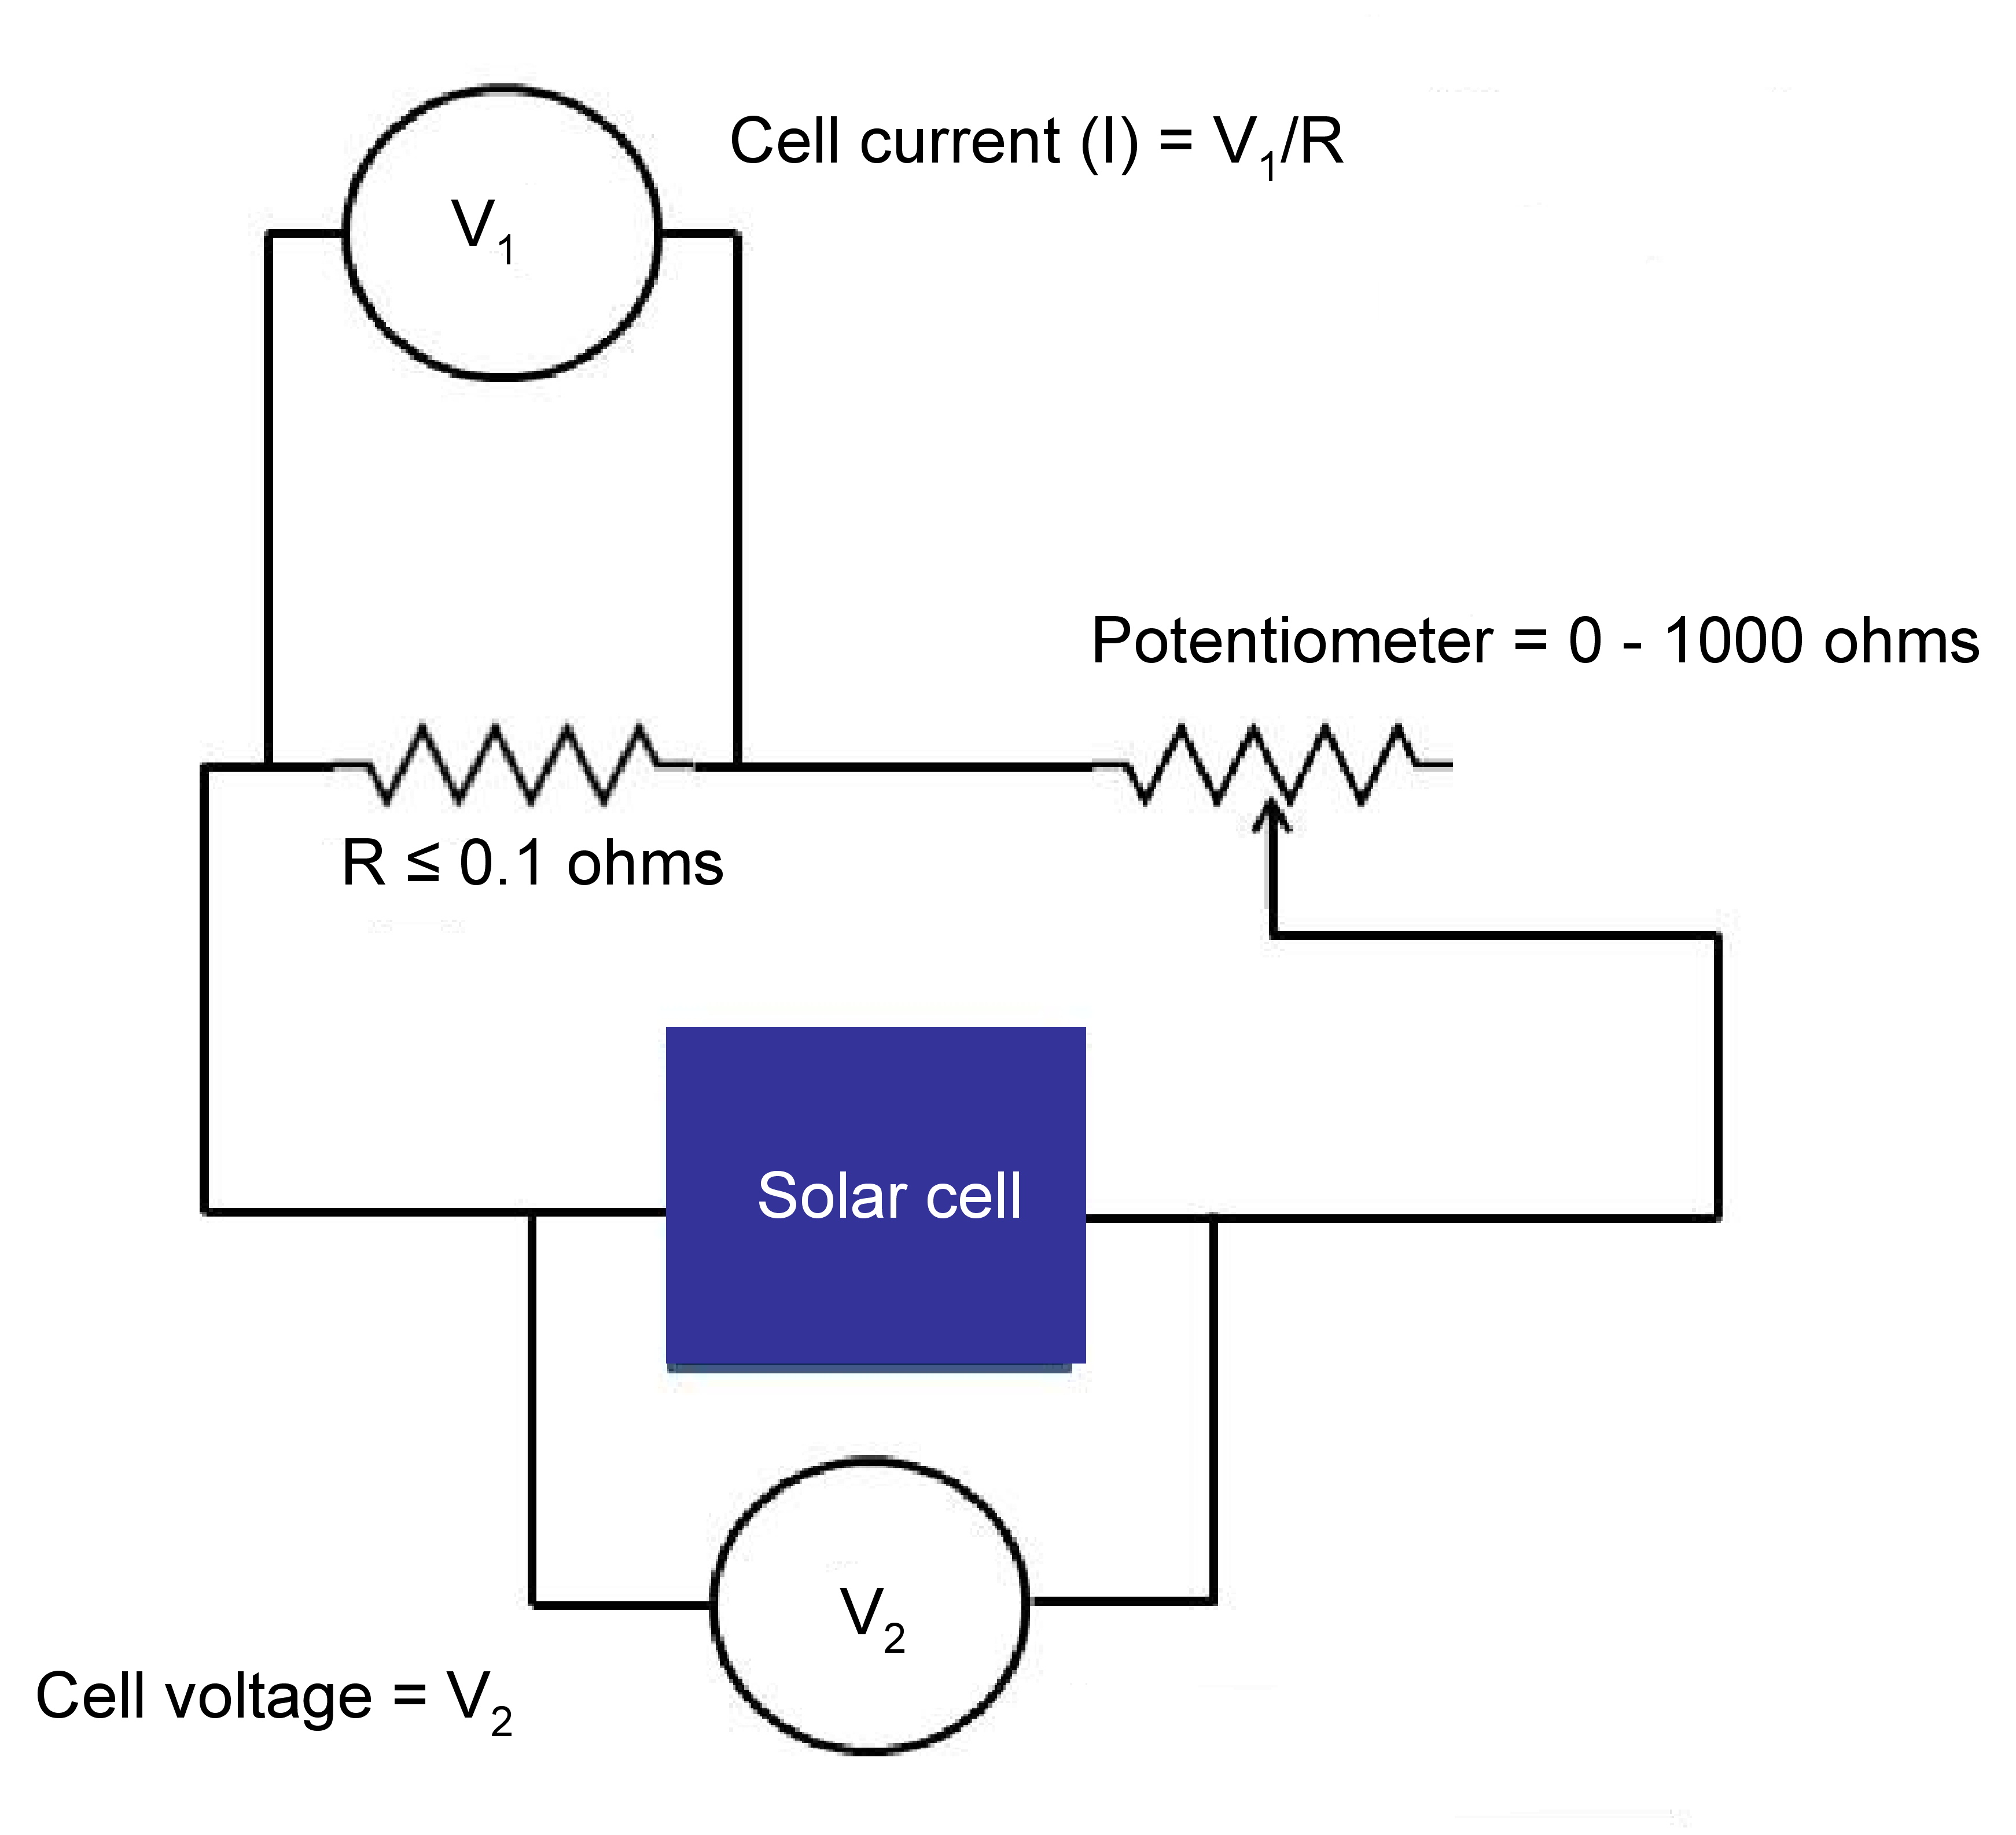
Driving the potentiometer to its maximum value will place the cell close to open circuit operation, depending on the potentiometer range, so that the open circuit voltage can be simply extrapolated from the I versus V curve. If desired, the circuit can simply be opened to make the actual measurement once the rest of the data have been recorded. Data in this case were simply recorded by hand and later entered into a spreadsheet so an I-V plot could be generated. A sample plot is shown in [link] . Keep in mind that cell efficiency cannot be determined with this technique unless the light source has been calibrated and color corrected to match terrestrial sunlight. The fact that the experimental device actually generated net power was the result sought. The shape of the curve and the very low voltage are the result of very large resistive losses in the device along with a very “leaky” junction.

Questions & Answers

how do you get the 2/50
Abba Reply
number of sport play by 50 student construct discrete data
Aminu Reply
width of the frangebany leaves on how to write a introduction
Theresa Reply
Solve the mean of variance
Veronica Reply
Step 1: Find the mean. To find the mean, add up all the scores, then divide them by the number of scores. ... Step 2: Find each score's deviation from the mean. ... Step 3: Square each deviation from the mean. ... Step 4: Find the sum of squares. ... Step 5: Divide the sum of squares by n – 1 or N.
kenneth
what is error
Yakuba Reply
Is mistake done to something
Vutshila
Hy
anas
hy
What is the life teble
anas
hy
Jibrin
statistics is the analyzing of data
Tajudeen Reply
what is statics?
Zelalem Reply
how do you calculate mean
Gloria Reply
diveving the sum if all values
Shaynaynay
let A1,A2 and A3 events be independent,show that (A1)^c, (A2)^c and (A3)^c are independent?
Fisaye Reply
what is statistics
Akhisani Reply
data collected all over the world
Shaynaynay
construct a less than and more than table
Imad Reply
The sample of 16 students is taken. The average age in the sample was 22 years with astandard deviation of 6 years. Construct a 95% confidence interval for the age of the population.
Aschalew Reply
Bhartdarshan' is an internet-based travel agency wherein customer can see videos of the cities they plant to visit. The number of hits daily is a normally distributed random variable with a mean of 10,000 and a standard deviation of 2,400 a. what is the probability of getting more than 12,000 hits? b. what is the probability of getting fewer than 9,000 hits?
Akshay Reply
Bhartdarshan'is an internet-based travel agency wherein customer can see videos of the cities they plan to visit. The number of hits daily is a normally distributed random variable with a mean of 10,000 and a standard deviation of 2,400. a. What is the probability of getting more than 12,000 hits
Akshay
1
Bright
Sorry i want to learn more about this question
Bright
Someone help
Bright
a= 0.20233 b=0.3384
Sufiyan
a
Shaynaynay
How do I interpret level of significance?
Mohd Reply
It depends on your business problem or in Machine Learning you could use ROC- AUC cruve to decide the threshold value
Shivam
how skewness and kurtosis are used in statistics
Owen Reply
yes what is it
Taneeya
Got questions? Join the online conversation and get instant answers!
Jobilize.com Reply

Get Jobilize Job Search Mobile App in your pocket Now!

Get it on Google Play Download on the App Store Now


Source:  OpenStax, Physical methods in chemistry and nano science. OpenStax CNX. May 05, 2015 Download for free at http://legacy.cnx.org/content/col10699/1.21
Google Play and the Google Play logo are trademarks of Google Inc.

Notification Switch

Would you like to follow the 'Physical methods in chemistry and nano science' conversation and receive update notifications?

Ask