

| << Chapter < Page | Chapter >> Page > |
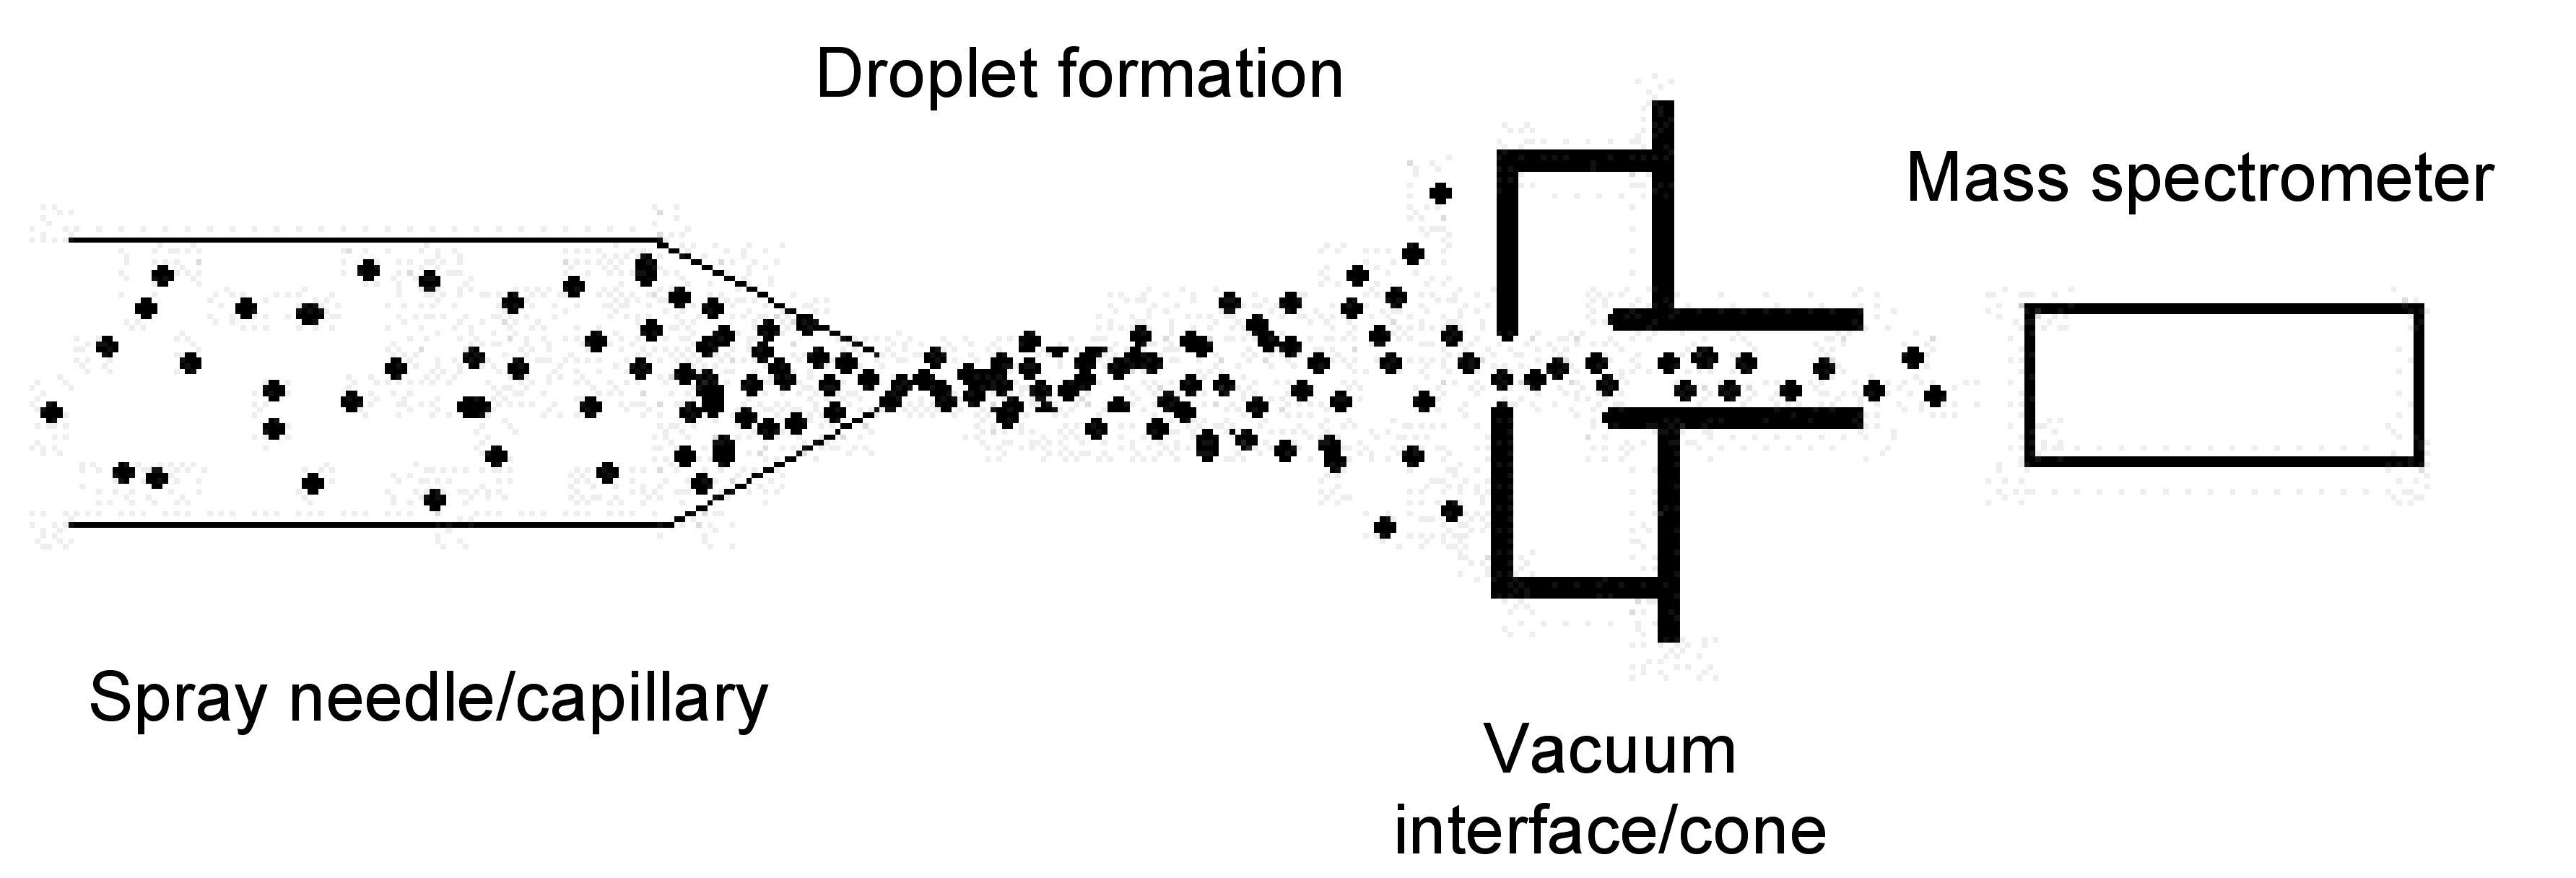
As implied by the name, the data produced from this technique is a mass spectrometry spectrum. Without delving too deeply into the topic of mass spectrometry, which is out of the true scope of this module, a slight explanation will be provided here. The mass spectrometer separates particles based on a magnetic field created by a quadrupole magnet. The strength of the interaction varies on the charge the particles carry. The amount of deflection or strength of interaction is determined by the ion detector and quantified into a mass/charge ( m/z ) ratio. Because of this information, determination of chemical composition or peptide structure can easily be managed as is explained in greater detail in the following section.
Interpreting the mass spectrometry data involves understanding the m/z ratio. The knowledge necessary to understanding the interpretation of the spectrum is that the peaks correspond to portions of the whole molecule. That is to say, hypothetically, if you put a human body in the mass spectrometer, one peak would coincide with one arm, another peak would coincide with the arm and the abdomen, etc. The general idea behind these peaks, is that an overlay would paint the entire picture, or in the case of the hypothetical example, provide the image of the human body. The m/z ratio defines these portions based on the charges carried by them; thus the terminology of the mass/charge ratio. The more charges a portion of the macromolecule or protein holds, the smaller the m/z ratio will be and the farther left it will appear on the spectrum. The fundamental concept behind interpretation involves understanding that the peaks are interrelated, and thus the math calculations may be carried out to provide relevant information of the protein or macromolecule being analyzed.
As mentioned above, the pertinent information to be obtained from the ESI-MS data is extrapolated from the understanding that the peaks are interrelated. The steps for calculating the data are as follow:
Notification Switch
Would you like to follow the 'Physical methods in chemistry and nano science' conversation and receive update notifications?

|
|

|
|

|
|

|
|
|
|
|

|
|

|
|

|
|
|
|
|
|
|