<< Chapter < Page Chapter >> Page >

Introduction

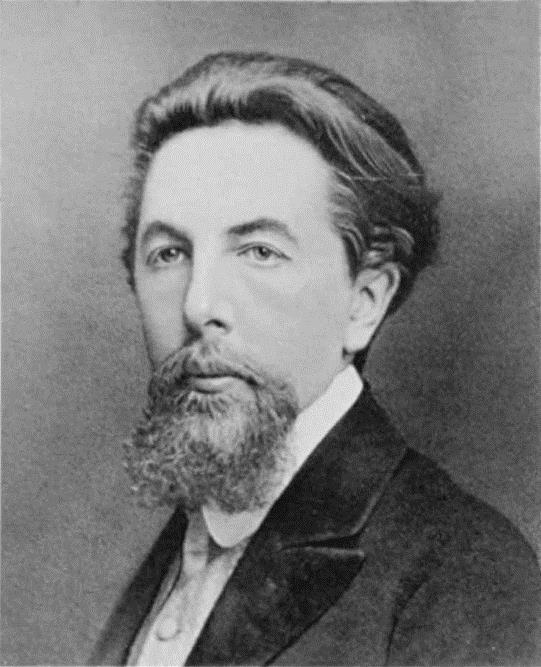
High-performance liquid chromatography (HPLC) is a technique in analytical chemistry used to separate the components in a mixture, and to identify and quantify each component. It was initially discovered as an analytical technique in the early twentieth century and was first used to separate colored compounds. The word chromatography means color writing . It was the botanist M. S. Tswett ( [link] ) who invented this method in around 1900 to study leaf pigments (mainly chlorophyll). He separated the pigments based on their interaction with a stationary phase. In 1906 Tswett published two fundamental papers describing the various aspects of liquid-adsorption chromatography in detail. He also pointed out that in spite of its name, other substances also could be separated by chromatography. The modern high performance liquid chromatography has developed from this separation; the separation efficiency, versatility and speed have been improved significantly.

Russian born Italian botanist Mikhail Semyonovich Tswett (1872-1919).

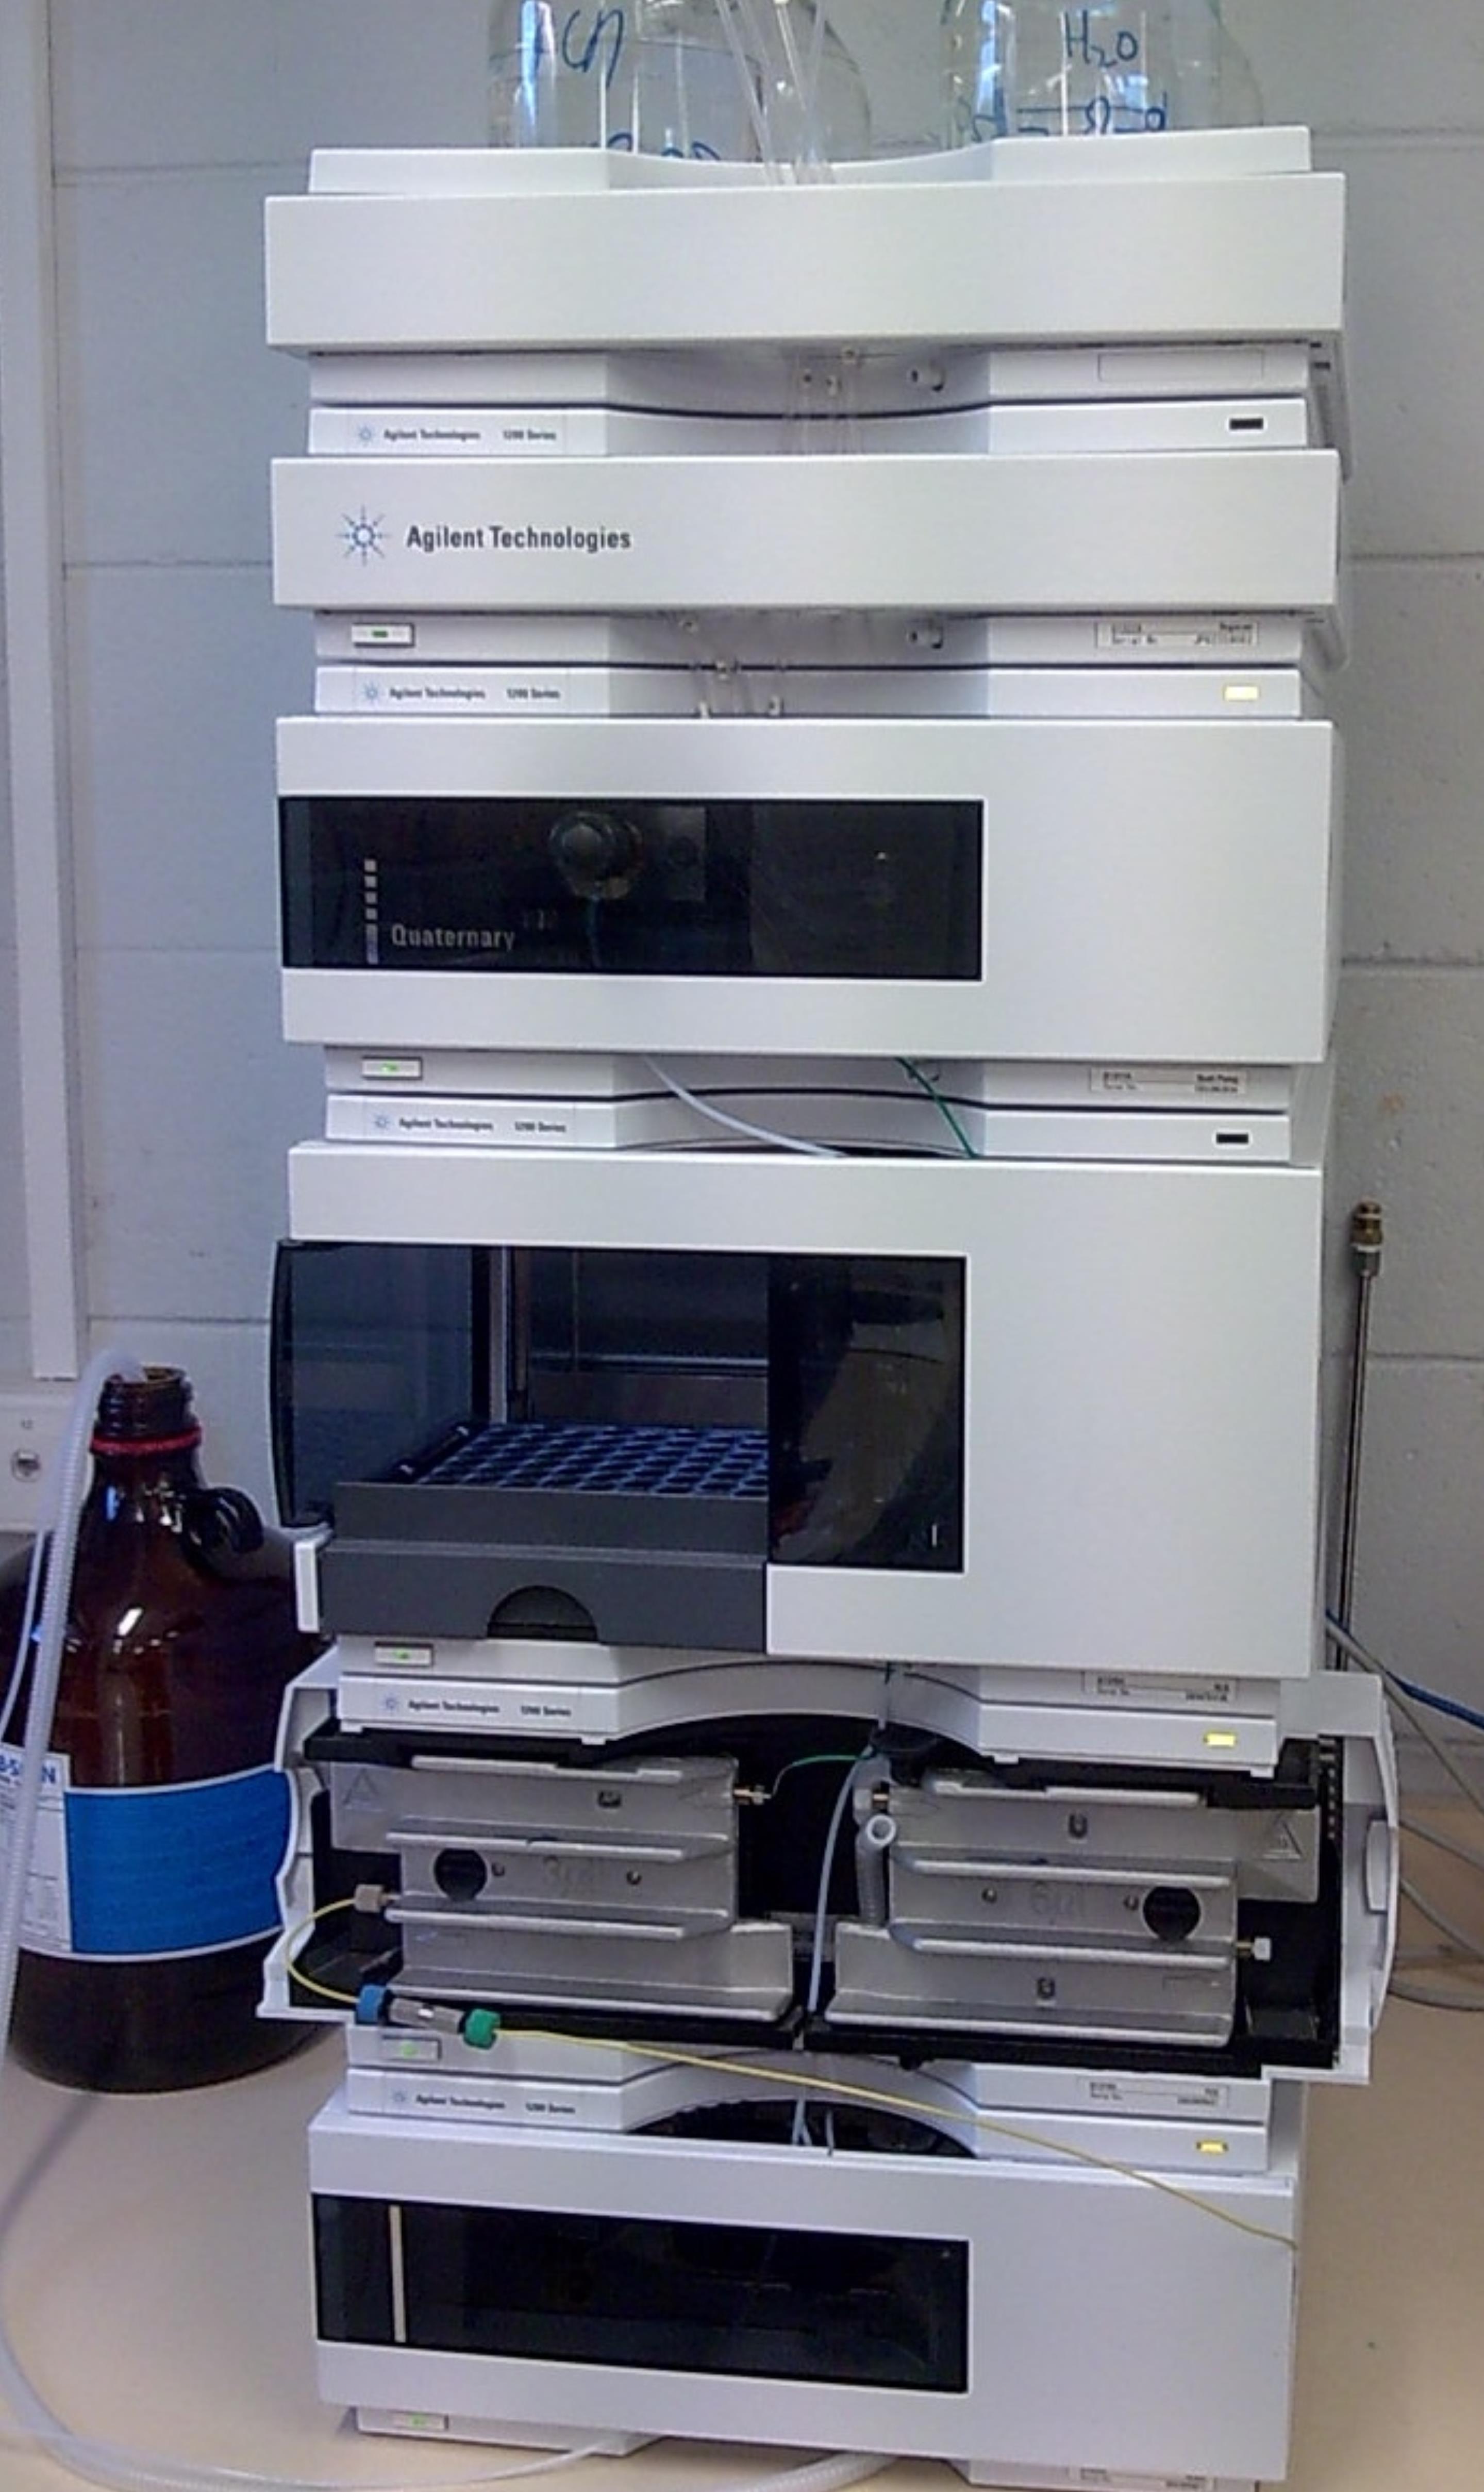
The molecular species subjected to separation exist in a sample that is made of analytes and matrix . The analytes are the molecular species of interest, and the matrix is the rest of the components in the sample. For chromatographic separation, the sample is introduced in a flowing mobile phase that passes a stationary phase . Mobile phase is a moving liquid, and is characterized by its composition, solubility, UV transparency, viscosity, and miscibility with other solvents. Stationary phase is a stationary medium, which can be a stagnant bulk liquid, a liquid layer on the solid phase, or an interfacial layer between liquid and solid. In HPLC, the stationary phase is typically in the form of a column packed with very small porous particles and the liquid mobile phase is moved through the column by a pump. The development of HPLC is mainly the development of the new columns, which requires new particles, new stationary phases (particle coatings), and improved procedures for packing the column. A picture of modern HPLC is shown in [link] .

A picture of modern HPLC instrument.

Instrumentation

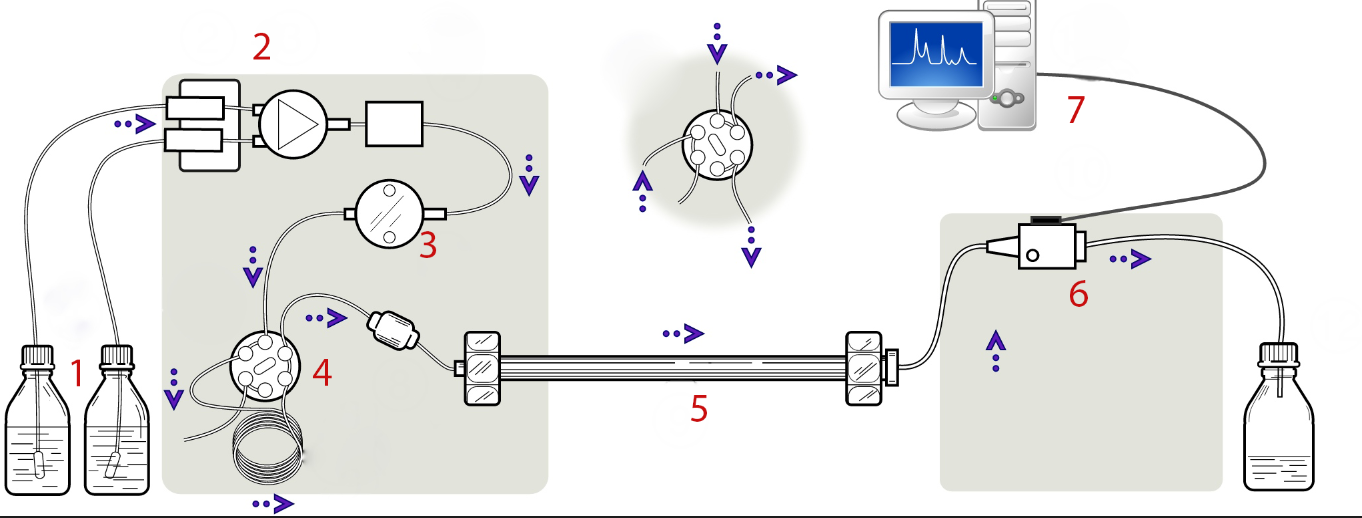
The major components of a HPLC are shown in [link] . The role of a pump is to force a liquid (mobile phase) through at a specific flow rate (milliliters per minute). The injector serves to introduce the liquid sample into the flow stream of the mobile phase. Column is the most central and important component of HPLC, and the column’s stationary phase separates the sample components of interest using various physical and chemical parameters. The detector is to detect the individual molecules that elute from the column. The computer usually functions as the data system, and the computer not only controls all the modules of the HPLC instrument but it takes the signal from the detector and uses it to determine the retention time, the sample components, and quantitative analysis.

Schematic representation of a HPLC system: (1) solvent, (2) gradient valve, (3) high-pressure pump, (4) sample injection loop, (5) analytical column, (6) detector, and (7) computer.

Questions & Answers

What are the factors that affect demand for a commodity
Florence Reply
differentiate between demand and supply giving examples
Lambiv Reply
differentiated between demand and supply using examples
Lambiv
what is labour ?
Lambiv
how will I do?
Venny Reply
how is the graph works?I don't fully understand
Rezat Reply
information
Eliyee
devaluation
Eliyee
t
WARKISA
hi guys good evening to all
Lambiv
multiple choice question
Aster Reply
appreciation
Eliyee
explain perfect market
Lindiwe Reply
In economics, a perfect market refers to a theoretical construct where all participants have perfect information, goods are homogenous, there are no barriers to entry or exit, and prices are determined solely by supply and demand. It's an idealized model used for analysis,
Ezea
What is ceteris paribus?
Shukri Reply
other things being equal
AI-Robot
When MP₁ becomes negative, TP start to decline. Extuples Suppose that the short-run production function of certain cut-flower firm is given by: Q=4KL-0.6K2 - 0.112 • Where is quantity of cut flower produced, I is labour input and K is fixed capital input (K-5). Determine the average product of lab
Kelo
Extuples Suppose that the short-run production function of certain cut-flower firm is given by: Q=4KL-0.6K2 - 0.112 • Where is quantity of cut flower produced, I is labour input and K is fixed capital input (K-5). Determine the average product of labour (APL) and marginal product of labour (MPL)
Kelo
yes,thank you
Shukri
Can I ask you other question?
Shukri
what is monopoly mean?
Habtamu Reply
What is different between quantity demand and demand?
Shukri Reply
Quantity demanded refers to the specific amount of a good or service that consumers are willing and able to purchase at a give price and within a specific time period. Demand, on the other hand, is a broader concept that encompasses the entire relationship between price and quantity demanded
Ezea
ok
Shukri
how do you save a country economic situation when it's falling apart
Lilia Reply
what is the difference between economic growth and development
Fiker Reply
Economic growth as an increase in the production and consumption of goods and services within an economy.but Economic development as a broader concept that encompasses not only economic growth but also social & human well being.
Shukri
production function means
Jabir
What do you think is more important to focus on when considering inequality ?
Abdisa Reply
any question about economics?
Awais Reply
sir...I just want to ask one question... Define the term contract curve? if you are free please help me to find this answer 🙏
Asui
it is a curve that we get after connecting the pareto optimal combinations of two consumers after their mutually beneficial trade offs
Awais
thank you so much 👍 sir
Asui
In economics, the contract curve refers to the set of points in an Edgeworth box diagram where both parties involved in a trade cannot be made better off without making one of them worse off. It represents the Pareto efficient allocations of goods between two individuals or entities, where neither p
Cornelius
In economics, the contract curve refers to the set of points in an Edgeworth box diagram where both parties involved in a trade cannot be made better off without making one of them worse off. It represents the Pareto efficient allocations of goods between two individuals or entities,
Cornelius
Suppose a consumer consuming two commodities X and Y has The following utility function u=X0.4 Y0.6. If the price of the X and Y are 2 and 3 respectively and income Constraint is birr 50. A,Calculate quantities of x and y which maximize utility. B,Calculate value of Lagrange multiplier. C,Calculate quantities of X and Y consumed with a given price. D,alculate optimum level of output .
Feyisa Reply
Answer
Feyisa
c
Jabir
the market for lemon has 10 potential consumers, each having an individual demand curve p=101-10Qi, where p is price in dollar's per cup and Qi is the number of cups demanded per week by the i th consumer.Find the market demand curve using algebra. Draw an individual demand curve and the market dema
Gsbwnw Reply
suppose the production function is given by ( L, K)=L¼K¾.assuming capital is fixed find APL and MPL. consider the following short run production function:Q=6L²-0.4L³ a) find the value of L that maximizes output b)find the value of L that maximizes marginal product
Abdureman
Got questions? Join the online conversation and get instant answers!
Jobilize.com Reply

Get Jobilize Job Search Mobile App in your pocket Now!

Get it on Google Play Download on the App Store Now


Source:  OpenStax, Physical methods in chemistry and nano science. OpenStax CNX. May 05, 2015 Download for free at http://legacy.cnx.org/content/col10699/1.21
Google Play and the Google Play logo are trademarks of Google Inc.

Notification Switch

Would you like to follow the 'Physical methods in chemistry and nano science' conversation and receive update notifications?

Ask