

| << Chapter < Page | Chapter >> Page > |
Energy-dispersive X-ray spectroscopy (EDX or EDS) is an analytical technique used to probe the composition of a solid materials. Several variants exist, but the all rely on exciting electrons near the nucleus, causing more distant electrons to drop energy levels to fill the resulting “holes.” Each element emits a different set of X-ray frequencies as their vacated lower energy states are refilled, so measuring these emissions can provide both qualitative and quantitative information about the near-surface makeup of the sample. However, accurate interpretation of this data is dependent on the presence of high-quality standards, and technical limitations can compromise the resolution.
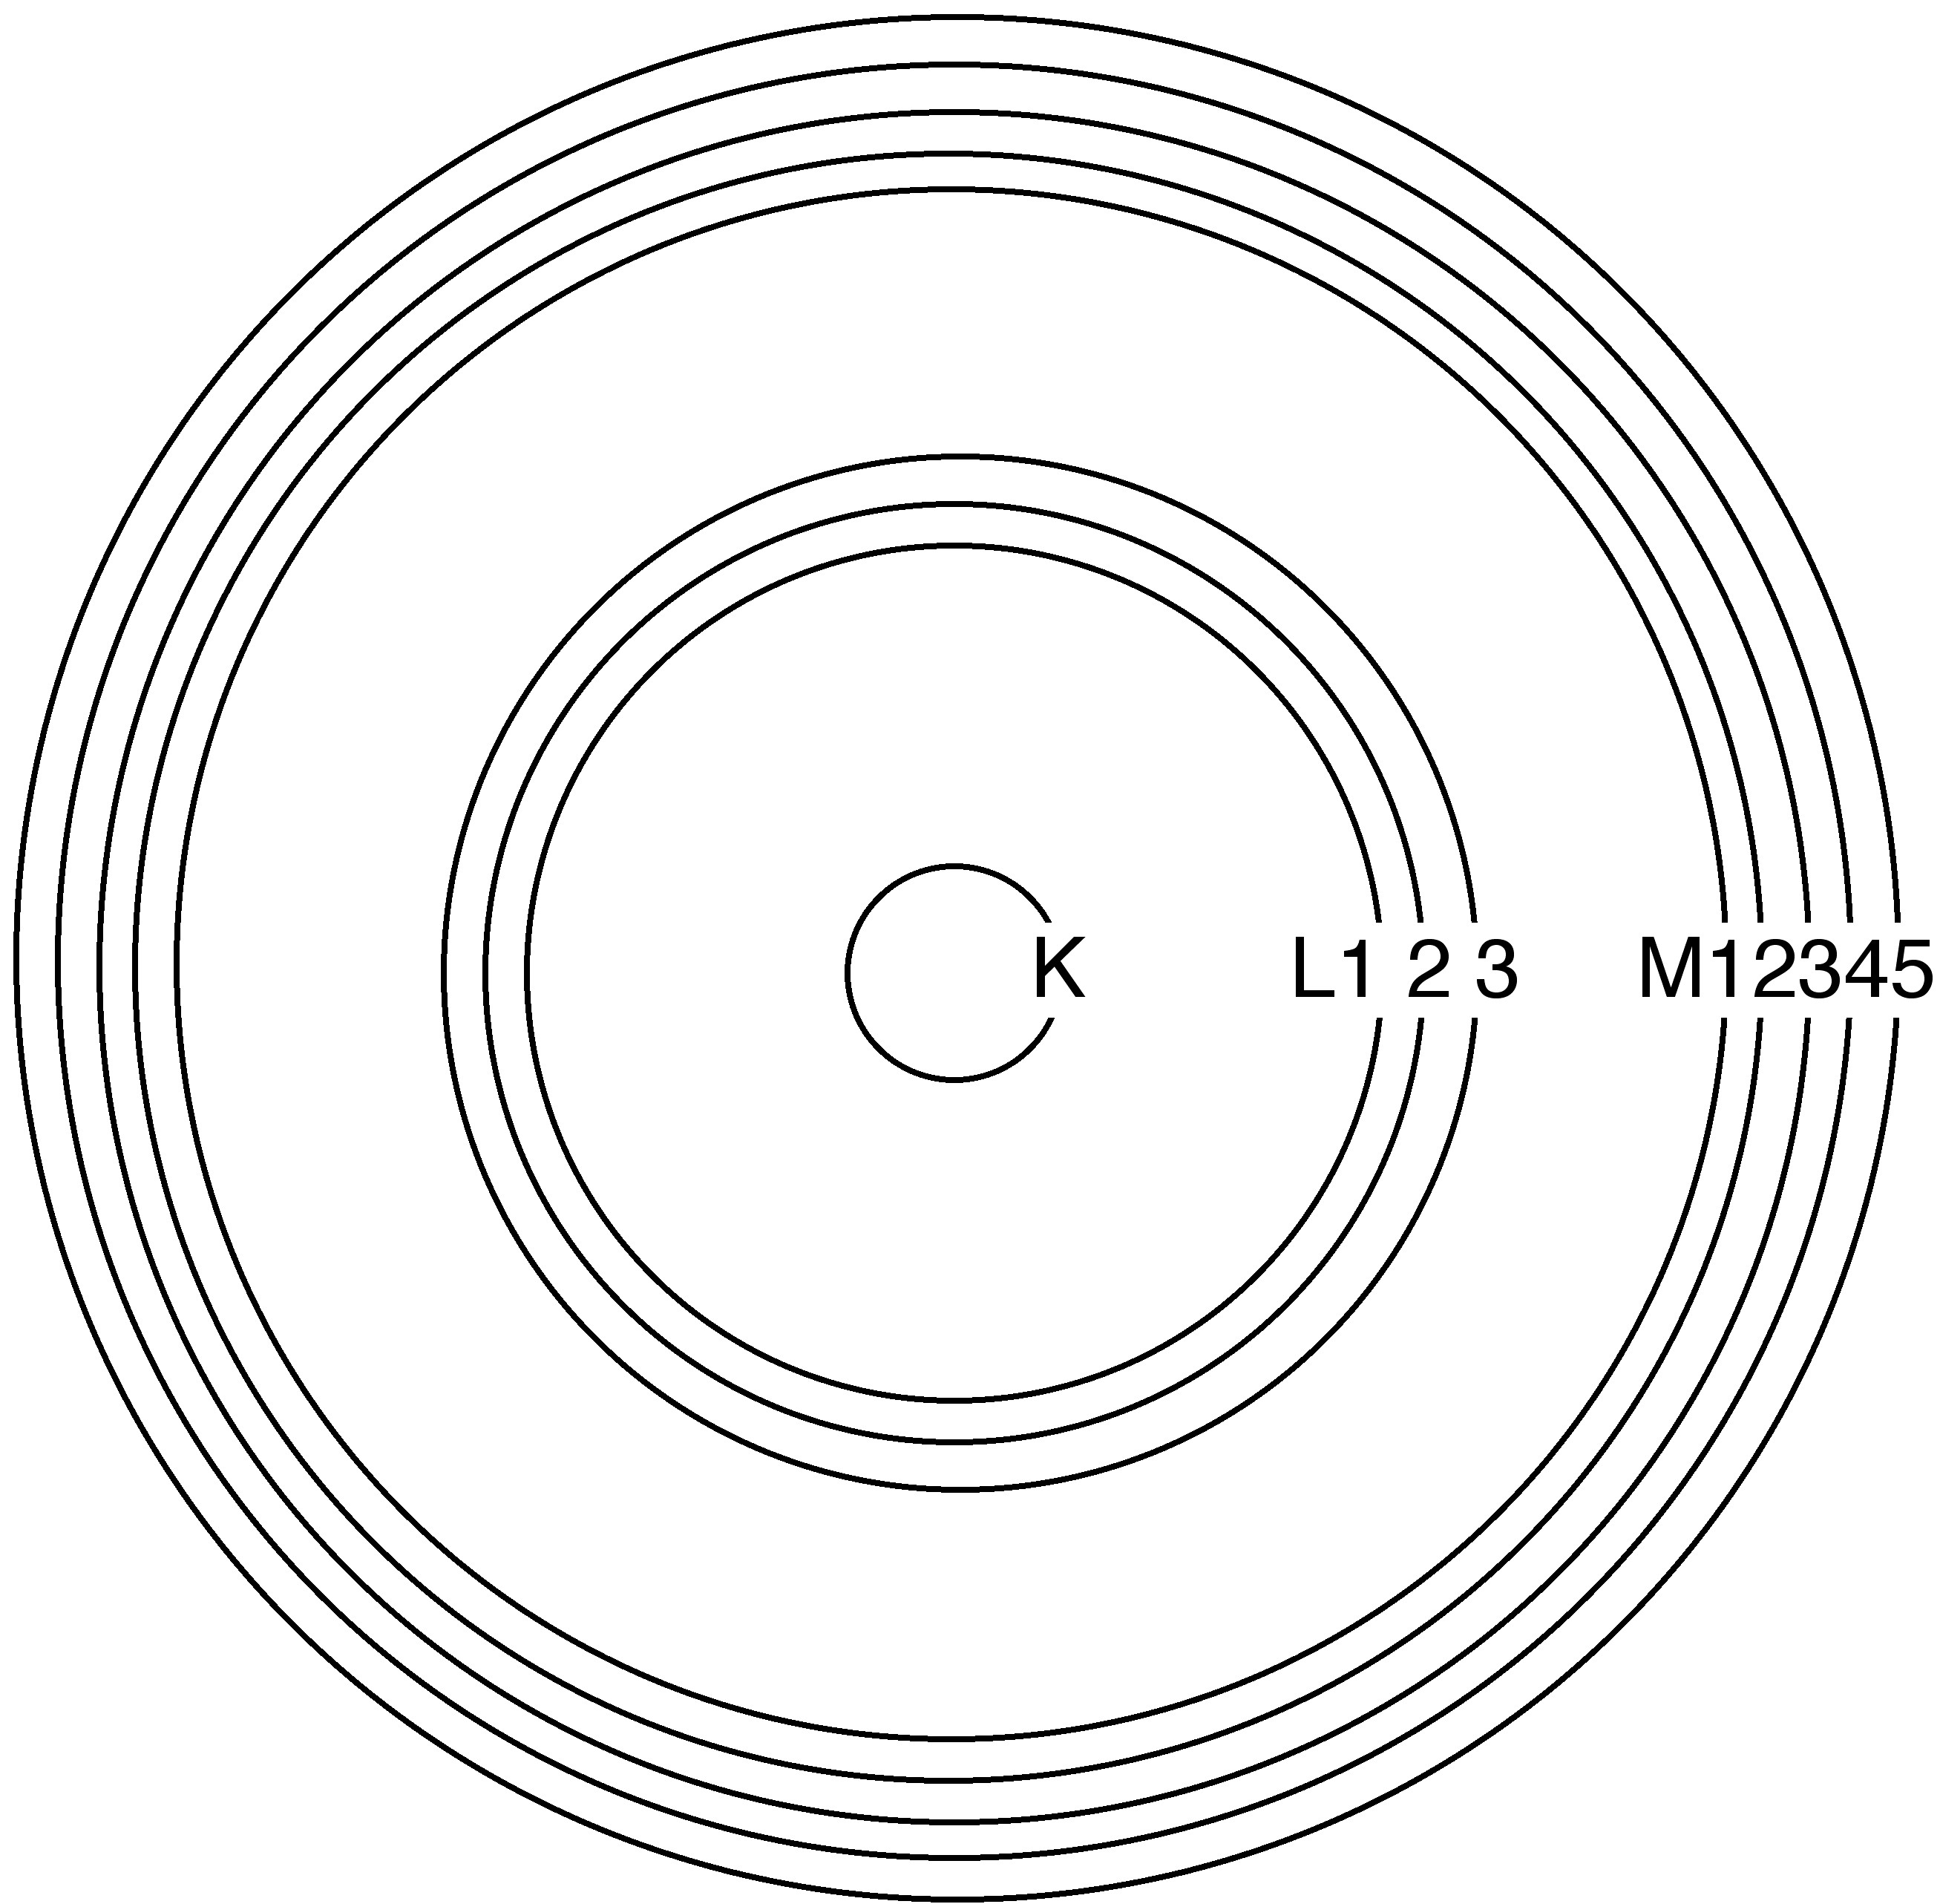
In the quantum mechanical model of the atom, an electron’s energy state is defined by a set of quantum numbers. The primary quantum number, n , provides the coarsest description of the electron’s energy level, and all the sublevels that share the same primary quantum number are sometimes said to comprise an energy “shell.” Instead of describing the lowest-energy shell as the “ n = 1 shell,” it is more common in spectroscopy to use alphabetical labels: The K shell has n = 1, the L shell has n = 2, the M shell has n = 3, and so on. Subsequent quantum numbers divide the shells into subshells: one for K, three for L, and five for M. Increasing primary quantum numbers correspond with increasing average distance from the nucleus and increasing energy ( [link] ). An atom’s core shells are those with lower primary quantum numbers than the highest occupied shell, or valence shell.
Transitions between energy levels follow the law of conservation of energy. Excitation of an electron to a higher energy state requires an input of energy from the surroundings, and relaxation to a lower energy state releases energy to the surroundings. One of the most common and useful ways energy can be transferred into and out of an atom is by electromagnetic radiation. Core shell transitions correspond to radiation in the X-ray portion of the spectrum; however, because the core shells are normally full by definition, these transitions are not usually observed.
X-ray spectroscopy uses a beam of electrons or high-energy radiation (see instrument variations, below) to excite core electrons to high energy states, creating a low-energy vacancy in the atoms’ electronic structures. This leads to a cascade of electrons from higher energy levels until the atom regains a minimum-energy state. Due to conservation of energy, the electrons emit X-rays as they transition to lower energy states. It is these X-rays that are being measured in X-ray spectroscopy. The energy transitions are named using the letter of the shell where ionization first occurred, a Greek letter denoting the group of lines that transition belongs to, in order of decreasing importance, and a numeric subscript ranking the peak's the intensity within that group. Thus, the most intense peak resulting from ionization in the K shell would be Kα 1 ( [link] ). Since each element has a different nuclear charge, the energies of the core shells and, more importantly, the spacing between them vary from one element to the next. While not every peak in an element’s spectrum is exclusive to that element, there are enough characteristic peaks to be able to determine composition of the sample, given sufficient resolving power.
Notification Switch
Would you like to follow the 'Physical methods in chemistry and nano science' conversation and receive update notifications?

|
|

|
|

|
|

|
|

|
|

|
|

|
|

|
|

|
|

|