<< Chapter < Page Chapter >> Page >
By the end of this section, you will be able to:
  • Explain the difference between the absorption spectrum and the emission spectrum of radiation emitted by atoms
  • Describe the Rutherford gold foil experiment and the discovery of the atomic nucleus
  • Explain the atomic structure of hydrogen
  • Describe the postulates of the early quantum theory for the hydrogen atom
  • Summarize how Bohr’s quantum model of the hydrogen atom explains the radiation spectrum of atomic hydrogen

Historically, Bohr’s model of the hydrogen atom is the very first model of atomic structure that correctly explained the radiation spectra of atomic hydrogen. The model has a special place in the history of physics because it introduced an early quantum theory, which brought about new developments in scientific thought and later culminated in the development of quantum mechanics. To understand the specifics of Bohr’s model, we must first review the nineteenth-century discoveries that prompted its formulation.

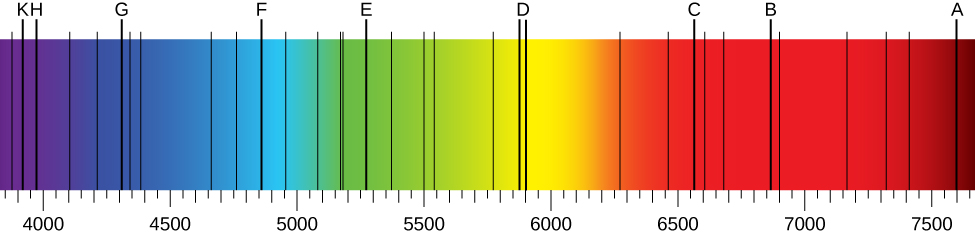
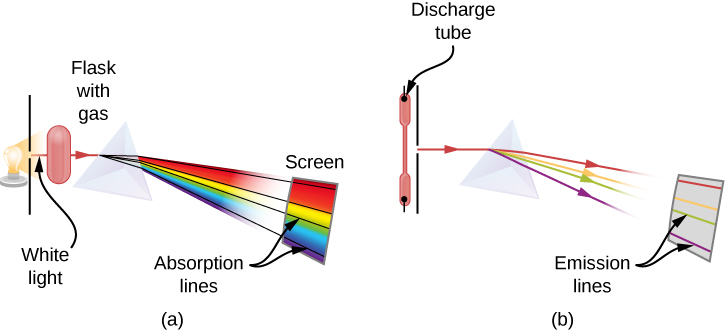
When we use a prism to analyze white light coming from the sun, several dark lines in the solar spectrum are observed ( [link] ). Solar absorption lines are called Fraunhofer lines    after Joseph von Fraunhofer , who accurately measured their wavelengths. During 1854–1861, Gustav Kirchhoff and Robert Bunsen discovered that for the various chemical elements, the line emission spectrum    of an element exactly matches its line absorption spectrum    . The difference between the absorption spectrum and the emission spectrum is explained in [link] . An absorption spectrum is observed when light passes through a gas. This spectrum appears as black lines that occur only at certain wavelengths on the background of the continuous spectrum of white light ( [link] ). The missing wavelengths tell us which wavelengths of the radiation are absorbed by the gas. The emission spectrum is observed when light is emitted by a gas. This spectrum is seen as colorful lines on the black background (see [link] and [link] ). Positions of the emission lines tell us which wavelengths of the radiation are emitted by the gas. Each chemical element has its own characteristic emission spectrum. For each element, the positions of its emission lines are exactly the same as the positions of its absorption lines. This means that atoms of a specific element absorb radiation only at specific wavelengths and radiation that does not have these wavelengths is not absorbed by the element at all. This also means that the radiation emitted by atoms of each element has exactly the same wavelengths as the radiation they absorb.

Figure depicts the solar emission spectrum in the visible range from the deep blue end of the spectrum measured at 380 nm, to the deep red part of the spectrum measured at 710 nm. Fraunhofer lines are observed as vertical black lines at specific spectral positions in the continuous spectrum.
In the solar emission spectrum in the visible range from 380 nm to 710 nm, Fraunhofer lines are observed as vertical black lines at specific spectral positions in the continuous spectrum. Highly sensitive modern instruments observe thousands of such lines.
Figures A and B show the schematics of an experimental setup to observe absorption lines. In Figure A, white light passes through the prism and gets separated into the wavelengths. In the spectrum of the passed light, some wavelengths are missing, which are seen as black absorption lines in the continuous spectrum on the viewing screen. In Figure B, light emitted by the gas in the discharge tube passes through the prism and gets separated into the wavelengths. In the spectrum of the passed light, only specific wavelengths are present, which are seen as colorful emission lines on the screen.
Observation of line spectra: (a) setup to observe absorption lines; (b) setup to observe emission lines. (a) White light passes through a cold gas that is contained in a glass flask. A prism is used to separate wavelengths of the passed light. In the spectrum of the passed light, some wavelengths are missing, which are seen as black absorption lines in the continuous spectrum on the viewing screen. (b) A gas is contained in a glass discharge tube that has electrodes at its ends. At a high potential difference between the electrodes, the gas glows and the light emitted from the gas passes through the prism that separates its wavelengths. In the spectrum of the emitted light, only specific wavelengths are present, which are seen as colorful emission lines on the screen.

Questions & Answers

how do you get the 2/50
Abba Reply
number of sport play by 50 student construct discrete data
Aminu Reply
width of the frangebany leaves on how to write a introduction
Theresa Reply
Solve the mean of variance
Veronica Reply
Step 1: Find the mean. To find the mean, add up all the scores, then divide them by the number of scores. ... Step 2: Find each score's deviation from the mean. ... Step 3: Square each deviation from the mean. ... Step 4: Find the sum of squares. ... Step 5: Divide the sum of squares by n – 1 or N.
kenneth
what is error
Yakuba Reply
Is mistake done to something
Vutshila
Hy
anas
hy
What is the life teble
anas
hy
Jibrin
statistics is the analyzing of data
Tajudeen Reply
what is statics?
Zelalem Reply
how do you calculate mean
Gloria Reply
diveving the sum if all values
Shaynaynay
let A1,A2 and A3 events be independent,show that (A1)^c, (A2)^c and (A3)^c are independent?
Fisaye Reply
what is statistics
Akhisani Reply
data collected all over the world
Shaynaynay
construct a less than and more than table
Imad Reply
The sample of 16 students is taken. The average age in the sample was 22 years with astandard deviation of 6 years. Construct a 95% confidence interval for the age of the population.
Aschalew Reply
Bhartdarshan' is an internet-based travel agency wherein customer can see videos of the cities they plant to visit. The number of hits daily is a normally distributed random variable with a mean of 10,000 and a standard deviation of 2,400 a. what is the probability of getting more than 12,000 hits? b. what is the probability of getting fewer than 9,000 hits?
Akshay Reply
Bhartdarshan'is an internet-based travel agency wherein customer can see videos of the cities they plan to visit. The number of hits daily is a normally distributed random variable with a mean of 10,000 and a standard deviation of 2,400. a. What is the probability of getting more than 12,000 hits
Akshay
1
Bright
Sorry i want to learn more about this question
Bright
Someone help
Bright
a= 0.20233 b=0.3384
Sufiyan
a
Shaynaynay
How do I interpret level of significance?
Mohd Reply
It depends on your business problem or in Machine Learning you could use ROC- AUC cruve to decide the threshold value
Shivam
how skewness and kurtosis are used in statistics
Owen Reply
yes what is it
Taneeya
Got questions? Join the online conversation and get instant answers!
Jobilize.com Reply

Get Jobilize Job Search Mobile App in your pocket Now!

Get it on Google Play Download on the App Store Now


Source:  OpenStax, University physics volume 3. OpenStax CNX. Nov 04, 2016 Download for free at http://cnx.org/content/col12067/1.4
Google Play and the Google Play logo are trademarks of Google Inc.

Notification Switch

Would you like to follow the 'University physics volume 3' conversation and receive update notifications?

Ask