<< Chapter < Page Chapter >> Page >
By the end of this section, you will be able to:
  • Describe the conic sections and how they relate to orbital motion
  • Describe how orbital velocity is related to conservation of angular momentum
  • Determine the period of an elliptical orbit from its major axis

Using the precise data collected by Tycho Brahe, Johannes Kepler carefully analyzed the positions in the sky of all the known planets and the Moon, plotting their positions at regular intervals of time. From this analysis, he formulated three laws, which we address in this section.

Kepler’s first law

The prevailing view during the time of Kepler was that all planetary orbits were circular. The data for Mars presented the greatest challenge to this view and that eventually encouraged Kepler to give up the popular idea. Kepler’s first law    states that every planet moves along an ellipse, with the Sun located at a focus of the ellipse. An ellipse is defined as the set of all points such that the sum of the distance from each point to two foci is a constant. [link] shows an ellipse and describes a simple way to create it.

Figure a shows an x y coordinate system and an ellipse centered on the origin with foci f 1 on the left and f 2 on the right, both on the x axis. Focus f 1 is also labeled M. A point above focus f 2 is labeled m. The right triangle formed by f 1, f 2, and m is shown in red. Figure b shows a similar ellipse, with the sun shown and labeled as M and as Sun at f 1. A planet mass m is shown above f 1, at a vertical distance r from f 1. The location where the ellipse intersects the horizontal axis on the left is labeled as point A, and the location where the ellipse intersects the horizontal axis on the right is labeled as point B.
(a) An ellipse is a curve in which the sum of the distances from a point on the curve to two foci ( f 1 and f 2 ) is a constant. From this definition, you can see that an ellipse can be created in the following way. Place a pin at each focus, then place a loop of string around a pencil and the pins. Keeping the string taught, move the pencil around in a complete circuit. If the two foci occupy the same place, the result is a circle—a special case of an ellipse. (b) For an elliptical orbit, if m M , then m follows an elliptical path with M at one focus. More exactly, both m and M move in their own ellipse about the common center of mass.

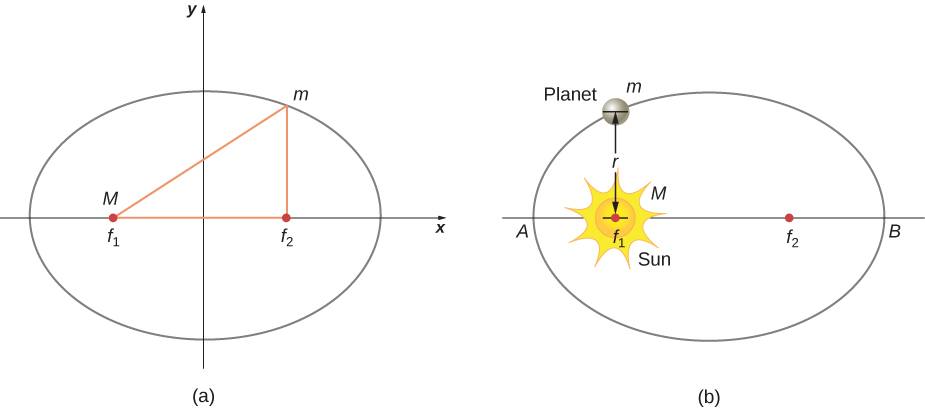
For elliptical orbits, the point of closest approach of a planet to the Sun is called the perihelion    . It is labeled point A in [link] . The farthest point is the aphelion    and is labeled point B in the figure. For the Moon’s orbit about Earth, those points are called the perigee and apogee, respectively.

An ellipse has several mathematical forms, but all are a specific case of the more general equation for conic sections. There are four different conic sections, all given by the equation
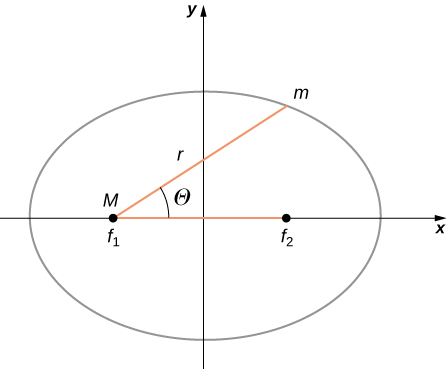
α r = 1 + e cos θ .

The variables r and θ are shown in [link] in the case of an ellipse. The constants α and e are determined by the total energy and angular momentum of the satellite at a given point. The constant e is called the eccentricity. The values of α and e determine which of the four conic sections represents the path of the satellite.

An x y coordinate system and an ellipse centered on the origin with foci f 1 on the left and f 2 on the right, both on the x axis, are shown. Focus f 1 is also labeled M. A point on the ellipse in the first quadrant is labeled m. The horizontal segment connecting the foci f 1 and f 2, and the segment connecting f 1 and m are shown in red. The angle between those segments is labeled Theta.
As before, the distance between the planet and the Sun is r , and the angle measured from the x -axis, which is along the major axis of the ellipse, is θ .

One of the real triumphs of Newton’s law of universal gravitation, with the force proportional to the inverse of the distance squared, is that when it is combined with his second law, the solution for the path of any satellite is a conic section. Every path taken by m is one of the four conic sections: a circle or an ellipse for bound or closed orbits, or a parabola or hyperbola for unbounded or open orbits. These conic sections are shown in [link] .

Questions & Answers

What are the factors that affect demand for a commodity
Florence Reply
differentiate between demand and supply giving examples
Lambiv Reply
differentiated between demand and supply using examples
Lambiv
what is labour ?
Lambiv
how will I do?
Venny Reply
how is the graph works?I don't fully understand
Rezat Reply
information
Eliyee
devaluation
Eliyee
t
WARKISA
hi guys good evening to all
Lambiv
multiple choice question
Aster Reply
appreciation
Eliyee
explain perfect market
Lindiwe Reply
In economics, a perfect market refers to a theoretical construct where all participants have perfect information, goods are homogenous, there are no barriers to entry or exit, and prices are determined solely by supply and demand. It's an idealized model used for analysis,
Ezea
What is ceteris paribus?
Shukri Reply
other things being equal
AI-Robot
When MP₁ becomes negative, TP start to decline. Extuples Suppose that the short-run production function of certain cut-flower firm is given by: Q=4KL-0.6K2 - 0.112 • Where is quantity of cut flower produced, I is labour input and K is fixed capital input (K-5). Determine the average product of lab
Kelo
Extuples Suppose that the short-run production function of certain cut-flower firm is given by: Q=4KL-0.6K2 - 0.112 • Where is quantity of cut flower produced, I is labour input and K is fixed capital input (K-5). Determine the average product of labour (APL) and marginal product of labour (MPL)
Kelo
yes,thank you
Shukri
Can I ask you other question?
Shukri
what is monopoly mean?
Habtamu Reply
What is different between quantity demand and demand?
Shukri Reply
Quantity demanded refers to the specific amount of a good or service that consumers are willing and able to purchase at a give price and within a specific time period. Demand, on the other hand, is a broader concept that encompasses the entire relationship between price and quantity demanded
Ezea
ok
Shukri
how do you save a country economic situation when it's falling apart
Lilia Reply
what is the difference between economic growth and development
Fiker Reply
Economic growth as an increase in the production and consumption of goods and services within an economy.but Economic development as a broader concept that encompasses not only economic growth but also social & human well being.
Shukri
production function means
Jabir
What do you think is more important to focus on when considering inequality ?
Abdisa Reply
any question about economics?
Awais Reply
sir...I just want to ask one question... Define the term contract curve? if you are free please help me to find this answer 🙏
Asui
it is a curve that we get after connecting the pareto optimal combinations of two consumers after their mutually beneficial trade offs
Awais
thank you so much 👍 sir
Asui
In economics, the contract curve refers to the set of points in an Edgeworth box diagram where both parties involved in a trade cannot be made better off without making one of them worse off. It represents the Pareto efficient allocations of goods between two individuals or entities, where neither p
Cornelius
In economics, the contract curve refers to the set of points in an Edgeworth box diagram where both parties involved in a trade cannot be made better off without making one of them worse off. It represents the Pareto efficient allocations of goods between two individuals or entities,
Cornelius
Suppose a consumer consuming two commodities X and Y has The following utility function u=X0.4 Y0.6. If the price of the X and Y are 2 and 3 respectively and income Constraint is birr 50. A,Calculate quantities of x and y which maximize utility. B,Calculate value of Lagrange multiplier. C,Calculate quantities of X and Y consumed with a given price. D,alculate optimum level of output .
Feyisa Reply
Answer
Feyisa
c
Jabir
the market for lemon has 10 potential consumers, each having an individual demand curve p=101-10Qi, where p is price in dollar's per cup and Qi is the number of cups demanded per week by the i th consumer.Find the market demand curve using algebra. Draw an individual demand curve and the market dema
Gsbwnw Reply
suppose the production function is given by ( L, K)=L¼K¾.assuming capital is fixed find APL and MPL. consider the following short run production function:Q=6L²-0.4L³ a) find the value of L that maximizes output b)find the value of L that maximizes marginal product
Abdureman
Got questions? Join the online conversation and get instant answers!
Jobilize.com Reply
Practice Key Terms 5

Get Jobilize Job Search Mobile App in your pocket Now!

Get it on Google Play Download on the App Store Now


Source:  OpenStax, University physics volume 1. OpenStax CNX. Sep 19, 2016 Download for free at http://cnx.org/content/col12031/1.5
Google Play and the Google Play logo are trademarks of Google Inc.

Notification Switch

Would you like to follow the 'University physics volume 1' conversation and receive update notifications?

Ask