<< Chapter < Page Chapter >> Page >

We have noted that distance traveled can be greater than displacement. So average speed can be greater than average velocity, which is displacement divided by time. For example, if you drive to a store and return home in half an hour, and your car’s odometer shows the total distance traveled was 6 km, then your average speed was 12 km/h. Your average velocity, however, was zero, because your displacement for the round trip is zero. (Displacement is change in position and, thus, is zero for a round trip.) Thus average speed is not simply the magnitude of average velocity.

A house and a store, with a set of arrows in between showing that the distance between them is 3 point 0 kilometers and the total distance traveled, delta x total, equals 0 kilometers.
During a 30-minute round trip to the store, the total distance traveled is 6 km. The average speed is 12 km/h. The displacement for the round trip is zero, since there was no net change in position. Thus the average velocity is zero.

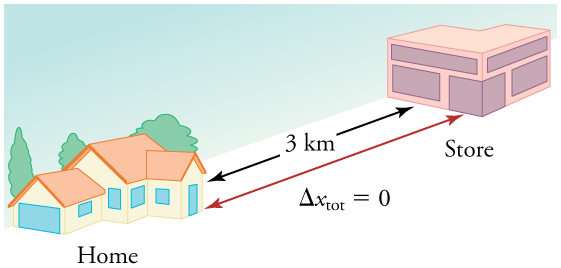
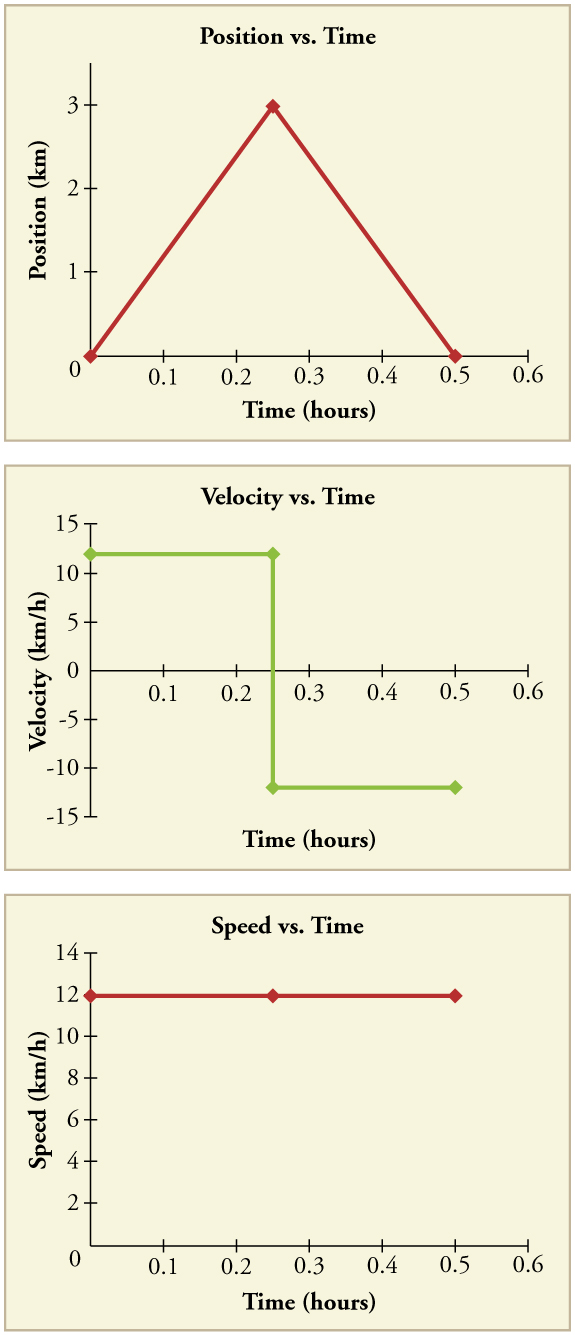
Another way of visualizing the motion of an object is to use a graph. A plot of position or of velocity as a function of time can be very useful. For example, for this trip to the store, the position, velocity, and speed-vs.-time graphs are displayed in [link] . (Note that these graphs depict a very simplified model    of the trip. We are assuming that speed is constant during the trip, which is unrealistic given that we’ll probably stop at the store. But for simplicity’s sake, we will model it with no stops or changes in speed. We are also assuming that the route between the store and the house is a perfectly straight line.)

Three line graphs. First line graph is of position in kilometers versus time in hours. The line increases linearly from 0 kilometers to 6 kilometers in the first 0 point 25 hours. It then decreases linearly from 6 kilometers to 0 kilometers between 0 point 25 and 0 point 5 hours. Second line graph shows velocity in kilometers per hour versus time in hours. The line is flat at 12 kilometers per hour from time 0 to time 0 point 25. It is vertical at time 0 point 25, dropping from 12 kilometers per hour to negative 12 kilometers per hour. It is flat again at negative 12 kilometers per hour from 0 point 25 hours to 0 point 5 hours. Third line graph shows speed in kilometers per hour versus time in hours. The line is flat at 12 kilometers per hour from time equals 0 to time equals 0 point 5 hours.
Position vs. time, velocity vs. time, and speed vs. time on a trip. Note that the velocity for the return trip is negative.

Making connections: take-home investigation—getting a sense of speed

If you have spent much time driving, you probably have a good sense of speeds between about 10 and 70 miles per hour. But what are these in meters per second? What do we mean when we say that something is moving at 10 m/s? To get a better sense of what these values really mean, do some observations and calculations on your own:

  • calculate typical car speeds in meters per second
  • estimate jogging and walking speed by timing yourself; convert the measurements into both m/s and mi/h
  • determine the speed of an ant, snail, or falling leaf

A commuter train travels from Baltimore to Washington, DC, and back in 1 hour and 45 minutes. The distance between the two stations is approximately 40 miles. What is (a) the average velocity of the train, and (b) the average speed of the train in m/s?

(a) The average velocity of the train is zero because x f = x 0 size 12{x rSub { size 8{f} } =x rSub { size 8{0} } } {} ; the train ends up at the same place it starts.

(b) The average speed of the train is calculated below. Note that the train travels 40 miles one way and 40 miles back, for a total distance of 80 miles.

distance time = 80 miles 105 minutes size 12{ { {"distance"} over {"time"} } = { {"80 miles"} over {"105 minutes"} } } {}
80 miles 105 minutes × 5280 feet 1 mile × 1 meter 3 . 28 feet × 1 minute 60 seconds = 20 m/s
Got questions? Get instant answers now!

Section summary

  • Time is measured in terms of change, and its SI unit is the second (s). Elapsed time for an event is
    Δ t = t f t 0 , size 12{Δt=t rSub { size 8{f} } - t rSub { size 8{0} } } {}
    where t f size 12{t rSub { size 8{f} } } {} is the final time and t 0 size 12{t rSub { size 8{0} } } {} is the initial time. The initial time is often taken to be zero, as if measured with a stopwatch; the elapsed time is then just t size 12{t} {} .
  • Average velocity v - size 12{ { bar {v}}} {} is defined as displacement divided by the travel time. In symbols, average velocity is
    v - = Δ x Δ t = x f x 0 t f t 0 . size 12{ { bar {v}}= { {Δx} over {Δt} } = { {x rSub { size 8{f} } - x rSub { size 8{0} } } over {t rSub { size 8{f} } - t rSub { size 8{0} } } } "." } {}
  • The SI unit for velocity is m/s.
  • Velocity is a vector and thus has a direction.
  • Instantaneous velocity v size 12{v} {} is the velocity at a specific instant or the average velocity for an infinitesimal interval.
  • Instantaneous speed is the magnitude of the instantaneous velocity.
  • Instantaneous speed is a scalar quantity, as it has no direction specified.
  • Average speed is the total distance traveled divided by the elapsed time. (Average speed is not the magnitude of the average velocity.) Speed is a scalar quantity; it has no direction associated with it.

Questions & Answers

Ayele, K., 2003. Introductory Economics, 3rd ed., Addis Ababa.
Widad Reply
can you send the book attached ?
Ariel
?
Ariel
What is economics
Widad Reply
the study of how humans make choices under conditions of scarcity
AI-Robot
U(x,y) = (x×y)1/2 find mu of x for y
Desalegn Reply
U(x,y) = (x×y)1/2 find mu of x for y
Desalegn
what is ecnomics
Jan Reply
this is the study of how the society manages it's scarce resources
Belonwu
what is macroeconomic
John Reply
macroeconomic is the branch of economics which studies actions, scale, activities and behaviour of the aggregate economy as a whole.
husaini
etc
husaini
difference between firm and industry
husaini Reply
what's the difference between a firm and an industry
Abdul
firm is the unit which transform inputs to output where as industry contain combination of firms with similar production 😅😅
Abdulraufu
Suppose the demand function that a firm faces shifted from Qd  120 3P to Qd  90  3P and the supply function has shifted from QS  20  2P to QS 10  2P . a) Find the effect of this change on price and quantity. b) Which of the changes in demand and supply is higher?
Toofiq Reply
explain standard reason why economic is a science
innocent Reply
factors influencing supply
Petrus Reply
what is economic.
Milan Reply
scares means__________________ends resources. unlimited
Jan
economics is a science that studies human behaviour as a relationship b/w ends and scares means which have alternative uses
Jan
calculate the profit maximizing for demand and supply
Zarshad Reply
Why qualify 28 supplies
Milan
what are explicit costs
Nomsa Reply
out-of-pocket costs for a firm, for example, payments for wages and salaries, rent, or materials
AI-Robot
concepts of supply in microeconomics
David Reply
economic overview notes
Amahle Reply
identify a demand and a supply curve
Salome Reply
i don't know
Parul
there's a difference
Aryan
Demand curve shows that how supply and others conditions affect on demand of a particular thing and what percent demand increase whith increase of supply of goods
Israr
Hi Sir please how do u calculate Cross elastic demand and income elastic demand?
Abari
Got questions? Join the online conversation and get instant answers!
Jobilize.com Reply
Practice Key Terms 7

Get Jobilize Job Search Mobile App in your pocket Now!

Get it on Google Play Download on the App Store Now


Source:  OpenStax, College physics. OpenStax CNX. Jul 27, 2015 Download for free at http://legacy.cnx.org/content/col11406/1.9
Google Play and the Google Play logo are trademarks of Google Inc.

Notification Switch

Would you like to follow the 'College physics' conversation and receive update notifications?

Ask