<< Chapter < Page Chapter >> Page >

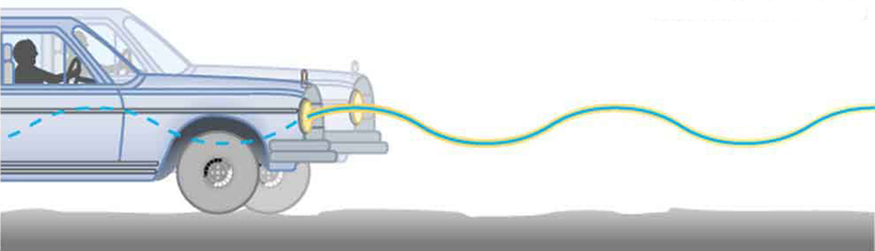
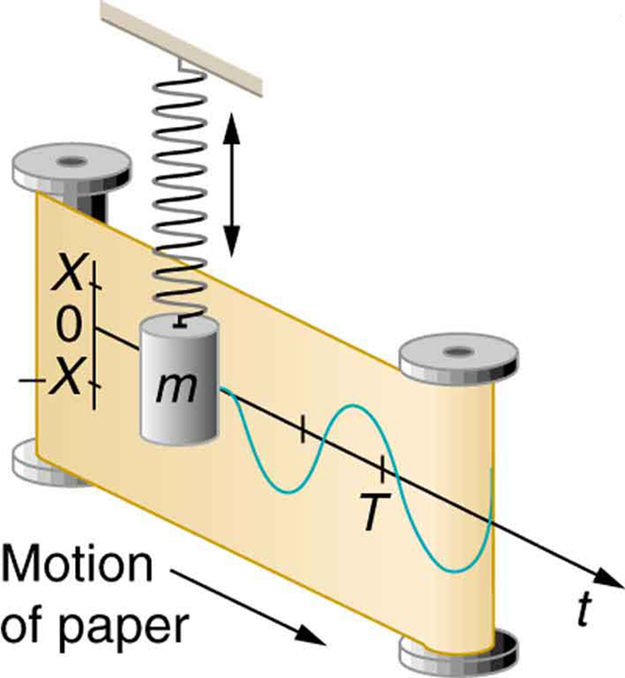
If a time-exposure photograph of the bouncing car were taken as it drove by, the headlight would make a wavelike streak, as shown in [link] . Similarly, [link] shows an object bouncing on a spring as it leaves a wavelike "trace of its position on a moving strip of paper. Both waves are sine functions. All simple harmonic motion is intimately related to sine and cosine waves.

The figure shows the front right side of a running car on an uneven rough surface which also shows the driver in the driving seat. There is an oscillating sine wave drawn from left to the right side horizontally throughout the figure.
The bouncing car makes a wavelike motion. If the restoring force in the suspension system can be described only by Hooke’s law, then the wave is a sine function. (The wave is the trace produced by the headlight as the car moves to the right.)
There are two iron paper roll bars standing vertically with a paper strip stitched from one bar to the other. There is a vertical hanging spring just over the middle of the two bars, perpendicular to the strip of the paper, having an object with mass m tied to it. There is a line graph with amplitude scale as X, zero and negative X on the left side of the paper strip, vertically over each other with their points marked. A perpendicular line is drawn through this amplitude scale toward the right with a point T marked over it, showing the time duration of the amplitude. This line has an oscillating wave drawn through it.
The vertical position of an object bouncing on a spring is recorded on a strip of moving paper, leaving a sine wave.

The displacement as a function of time t in any simple harmonic motion—that is, one in which the net restoring force can be described by Hooke’s law, is given by

x t = X cos 2 πt T , size 12{x left (t right )=X"cos" { {2π`t} over {T} } } {}

where X size 12{X} {} is amplitude. At t = 0 size 12{t=0} {} , the initial position is x 0 = X size 12{x rSub { size 8{0} } =X} {} , and the displacement oscillates back and forth with a period T . (When t = T , we get x = X size 12{x=X} {} again because cos = 1 .). Furthermore, from this expression for x size 12{x} {} , the velocity v size 12{v} {} as a function of time is given by:

v ( t ) = v max sin t T , size 12{v \( t \) = - v rSub { size 8{"max"} } "sin" left ( { {2π`t} over {T} } right )} {}

where v max = X / T = X k / m size 12{v rSub { size 8{"max"} } =2πX/T=X sqrt {k/m} } {} . The object has zero velocity at maximum displacement—for example, v = 0 size 12{v=0} {} when t = 0 size 12{t=0} {} , and at that time x = X size 12{x=X} {} . The minus sign in the first equation for v ( t ) size 12{v \( t \) } {} gives the correct direction for the velocity. Just after the start of the motion, for instance, the velocity is negative because the system is moving back toward the equilibrium point. Finally, we can get an expression for acceleration using Newton’s second law. [Then we have x ( t ) , v ( t ) , t , size 12{x \( t \) ,v \( t \) ,t} {} and a ( t ) size 12{a \( t \) } {} , the quantities needed for kinematics and a description of simple harmonic motion.] According to Newton’s second law, the acceleration is a = F / m = kx / m size 12{a=F/m= ital "kx"/m} {} . So, a ( t ) size 12{a \( t \) } {} is also a cosine function:

a ( t ) = kX m cos t T . size 12{a \( t \) = - { { ital "kX"} over {m} } " cos " { {2π t} over {T} } } {}

Hence, a ( t ) size 12{a \( t \) } {} is directly proportional to and in the opposite direction to x ( t ) .

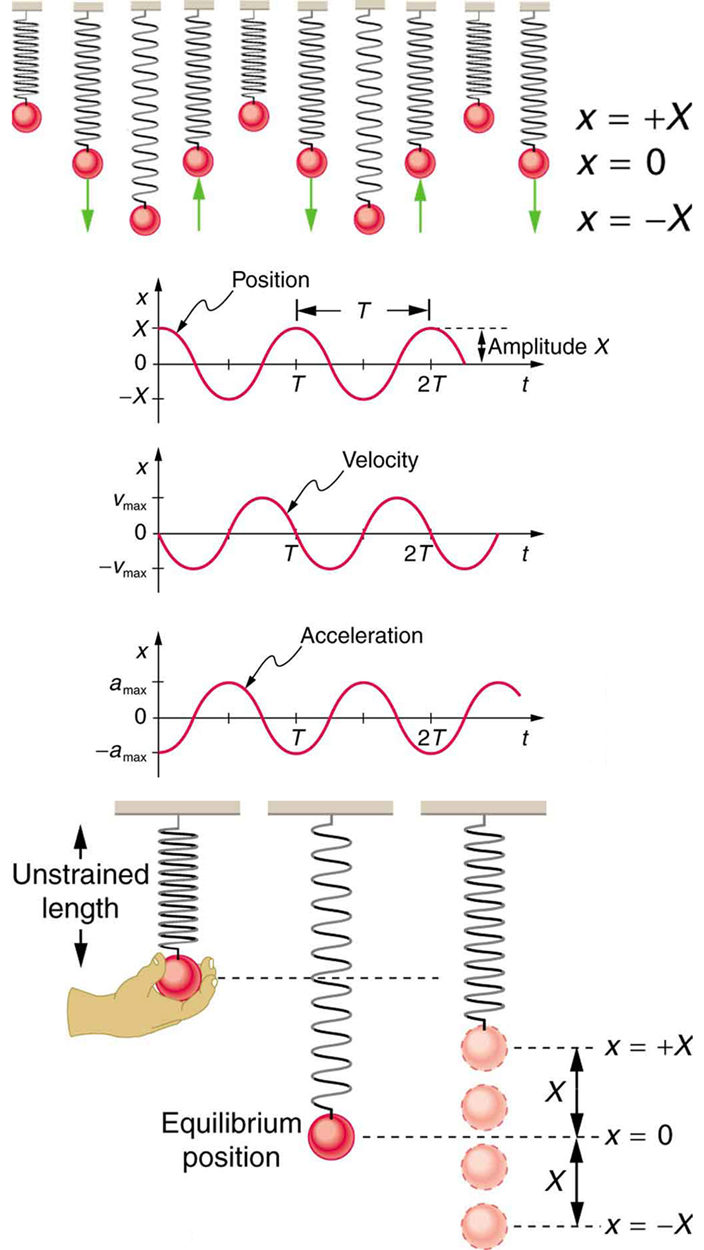
[link] shows the simple harmonic motion of an object on a spring and presents graphs of x ( t ) , v ( t ), size 12{x \( t \) ,v \( t \) `} {} and a ( t ) size 12{`a \( t \) } {} versus time.

In the figure at the top there are ten springboards with objects of different mass values tied to them. This makes some springs highly compressed some as loosely stretched and some at equilibrium, which are shown as red spherical shaped. Alongside the figure there is a scale given for different amplitude values as x equal to positive X, zero and negative X. the upward and downward pointing arrows are shown with a few springboards.  In the second figure there are three graphs. The first graph shows distance covered in form of a sine wave starting from a point x units on positive y-axis. The height of the wave above x-axis is marked as amplitude. The gap between two consecutive crests is marked as T. Below first graph there is another graph showing velocity in form of a sine wave starting from the origin downward. In the third graph below the second one, acceleration is shown in the form of sine wave starting from x units on the negative y-axis upward. In the last figure three position of a spring are shown. The first position shows the unstretched length of a spring pendulum. A hand is holding the bob of the pendulum. In the second position the equilibrium position of the spring and bob is shown. This position is lower the first one. In the third case the up and down oscillations of the spring pendulum are shown. The bob is moving x units in upward and downward directions alternatively.
Graphs of x ( t ) , v ( t ) , size 12{x \( t \) ,v \( t \) `} {} and a ( t ) size 12{`a \( t \) } {} versus t size 12{t} {} for the motion of an object on a spring. The net force on the object can be described by Hooke’s law, and so the object undergoes simple harmonic motion. Note that the initial position has the vertical displacement at its maximum value X size 12{X} {} ; v size 12{v} {} is initially zero and then negative as the object moves down; and the initial acceleration is negative, back toward the equilibrium position and becomes zero at that point.

The most important point here is that these equations are mathematically straightforward and are valid for all simple harmonic motion. They are very useful in visualizing waves associated with simple harmonic motion, including visualizing how waves add with one another.

Suppose you pluck a banjo string. You hear a single note that starts out loud and slowly quiets over time. Describe what happens to the sound waves in terms of period, frequency and amplitude as the sound decreases in volume.

Frequency and period remain essentially unchanged. Only amplitude decreases as volume decreases.

Got questions? Get instant answers now!

Questions & Answers

how do you get the 2/50
Abba Reply
number of sport play by 50 student construct discrete data
Aminu Reply
width of the frangebany leaves on how to write a introduction
Theresa Reply
Solve the mean of variance
Veronica Reply
Step 1: Find the mean. To find the mean, add up all the scores, then divide them by the number of scores. ... Step 2: Find each score's deviation from the mean. ... Step 3: Square each deviation from the mean. ... Step 4: Find the sum of squares. ... Step 5: Divide the sum of squares by n – 1 or N.
kenneth
what is error
Yakuba Reply
Is mistake done to something
Vutshila
Hy
anas
hy
What is the life teble
anas
hy
Jibrin
statistics is the analyzing of data
Tajudeen Reply
what is statics?
Zelalem Reply
how do you calculate mean
Gloria Reply
diveving the sum if all values
Shaynaynay
let A1,A2 and A3 events be independent,show that (A1)^c, (A2)^c and (A3)^c are independent?
Fisaye Reply
what is statistics
Akhisani Reply
data collected all over the world
Shaynaynay
construct a less than and more than table
Imad Reply
The sample of 16 students is taken. The average age in the sample was 22 years with astandard deviation of 6 years. Construct a 95% confidence interval for the age of the population.
Aschalew Reply
Bhartdarshan' is an internet-based travel agency wherein customer can see videos of the cities they plant to visit. The number of hits daily is a normally distributed random variable with a mean of 10,000 and a standard deviation of 2,400 a. what is the probability of getting more than 12,000 hits? b. what is the probability of getting fewer than 9,000 hits?
Akshay Reply
Bhartdarshan'is an internet-based travel agency wherein customer can see videos of the cities they plan to visit. The number of hits daily is a normally distributed random variable with a mean of 10,000 and a standard deviation of 2,400. a. What is the probability of getting more than 12,000 hits
Akshay
1
Bright
Sorry i want to learn more about this question
Bright
Someone help
Bright
a= 0.20233 b=0.3384
Sufiyan
a
Shaynaynay
How do I interpret level of significance?
Mohd Reply
It depends on your business problem or in Machine Learning you could use ROC- AUC cruve to decide the threshold value
Shivam
how skewness and kurtosis are used in statistics
Owen Reply
yes what is it
Taneeya
Got questions? Join the online conversation and get instant answers!
Jobilize.com Reply
Practice Key Terms 3

Get Jobilize Job Search Mobile App in your pocket Now!

Get it on Google Play Download on the App Store Now


Source:  OpenStax, College physics for ap® courses. OpenStax CNX. Nov 04, 2016 Download for free at https://legacy.cnx.org/content/col11844/1.14
Google Play and the Google Play logo are trademarks of Google Inc.

Notification Switch

Would you like to follow the 'College physics for ap® courses' conversation and receive update notifications?

Ask