<< Chapter < Page Chapter >> Page >

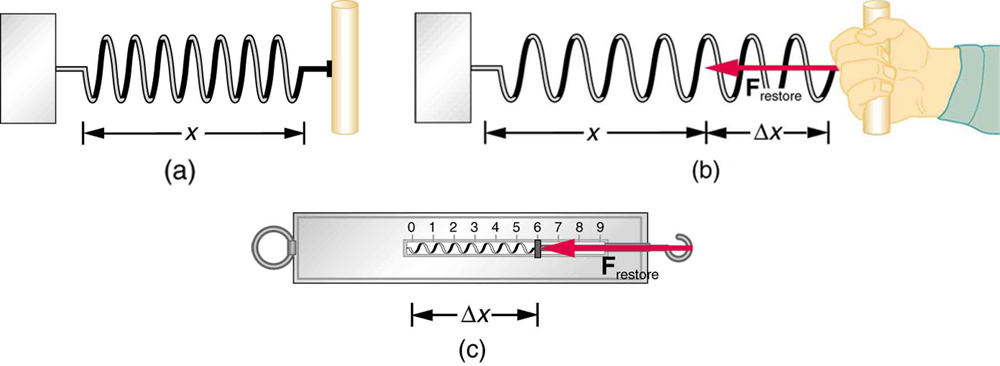
A more quantitative definition of force can be based on some standard force, just as distance is measured in units relative to a standard distance. One possibility is to stretch a spring a certain fixed distance, as illustrated in [link] , and use the force it exerts to pull itself back to its relaxed shape—called a restoring force —as a standard. The magnitude of all other forces can be stated as multiples of this standard unit of force. Many other possibilities exist for standard forces. (One that we will encounter in Magnetism is the magnetic force between two wires carrying electric current.) Some alternative definitions of force will be given later in this chapter.

(a) A spring of length x, fixed at one end, is shown in horizontal position. (b) The same spring is shown pulled by a person by a distance of delta x. The restoring force F restore is represented by an arrow pointing left toward the position where the spring is fixed. (c) A spring balance containing a spring stretched a distance delta x is shown. The restoring force is represented by an arrow F restore pointing toward the left in the direction opposite to the elongation of the spring.
The force exerted by a stretched spring can be used as a standard unit of force. (a) This spring has a length x size 12{x} {} when undistorted. (b) When stretched a distance Δ x size 12{Dx} {} , the spring exerts a restoring force, F restore size 12{F rSub { size 8{"restore"} } } {} , which is reproducible. (c) A spring scale is one device that uses a spring to measure force. The force F restore size 12{F rSub { size 8{"restore"} } } {} is exerted on whatever is attached to the hook. Here F restore size 12{F rSub { size 8{"restore"} } } {} has a magnitude of 6 units in the force standard being employed.

Take-home experiment: force standards

To investigate force standards and cause and effect, get two identical rubber bands. Hang one rubber band vertically on a hook. Find a small household item that could be attached to the rubber band using a paper clip, and use this item as a weight to investigate the stretch of the rubber band. Measure the amount of stretch produced in the rubber band with one, two, and four of these (identical) items suspended from the rubber band. What is the relationship between the number of items and the amount of stretch? How large a stretch would you expect for the same number of items suspended from two rubber bands? What happens to the amount of stretch of the rubber band (with the weights attached) if the weights are also pushed to the side with a pencil?

Test prep for ap courses

The diagram looks like a solid black oval race track with 16 equally-spaced short perpendicular hash marks crossing the track. The oval is longer than it is tall and the top and bottom parts of the track are horizontal and parallel to the bottom of the page. To complete the oval, the race track starts to curve in a half-circle starting from the second perpendicular hash mark to the right of the top center hash mark. The curve continues for four perpendicular hash marks and the horizontal bottom part of the track starts two perpendicular hash marks to the right of the center bottom hash mark. The half-circle is mirrored on the left side of the track. On the right side of the oval is an arrow curving around the track and pointing up with the text “Direction of Cars’ Motion.” There is one solid line above the track and one to the right outside of the track. Both lines are indicated by the lowercase letter d. One line starts at the first hash mark’s location on a horizontally straight bit of track in the upper right side and indicates that the size of the line goes for 4 additional hash marks. The second line starts at the end of the horizontal stretch on the upper left of the track and curves around for 4 additional hash marks.

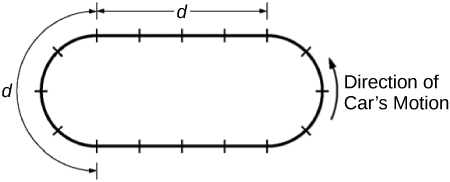
The figure above represents a racetrack with semicircular sections connected by straight sections. Each section has length d , and markers along the track are spaced d /4 apart. Two people drive cars counterclockwise around the track, as shown. Car X goes around the curves at constant speed v c, increases speed at constant acceleration for half of each straight section to reach a maximum speed of 2 v c, then brakes at constant acceleration for the other half of each straight section to return to speed v c. Car Y also goes around the curves at constant speed v c, increases its speed at constant acceleration for one-fourth of each straight section to reach the same maximum speed 2 v c, stays at that speed for half of each straight section, then brakes at constant acceleration for the remaining fourth of each straight section to return to speed v c.

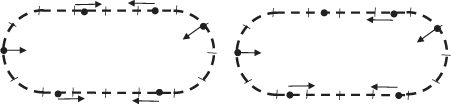
(a) On the figures below, draw an arrow showing the direction of the net force on each of the cars at the positions noted by the dots. If the net force is zero at any position, label the dot with 0.

There are two dashed oval tracks representative of the larger oval track shown in figure 04_M1_track_img earlier. Both tracks have the same 16 equally spaced perpendicular hash marks shown in the earlier figure but there are dashes around the tracks instead of a solid line. Between each of the perpendicular dashes is one smaller dash at the perpendicular dash and three additional dashes. Centered above the figure on the left is the text Car X and over the figure on the left is Car Y. There are 6 black dots positioned on each of the Car X and Car Y tracks. The position of the six dots on the Car X track on the left are as follows: The first dot is on dashed line on the perpendicular hash mark at the very center left of the track.  Moving to the right past three perpendicular hash marks the second dot is on the top horizontal line on the second of four small dashes before the top center perpendicular hash mark. The third dot is one perpendicular hash mark to the right of the center perpendicular hash mark. The fourth dot is two perpendicular hash marks from the third dot and one perpendicular hash mark above the right center perpendicular hash mark. The fifth dot is on the bottom horizontal line of the track and about one and one-third perpendicular hash marks to the right of the center bottom perpendicular hash mark. The sixth dot is on the bottom horizontal line about one and two-third perpendicular hash marks to the left of the center bottom perpendicular dash.

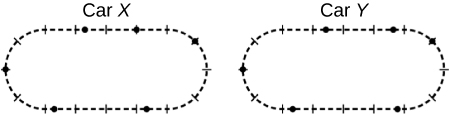
The position of the six dots on the Car Y track on the right are as follows:

  • The first dot on the left center of the track is at the same position as it is on the Car X track.
  • The second dot is just slight to the right of the Car X dot (less than a dash) past three perpendicular hash marks moving to the right.
  • The third dot is about one and two-thirds perpendicular hash marks to the right of the center top perpendicular has mark.
  • The fourth dot is in the same position as the Car X figure (one perpendicular hash mark above the center right perpendicular hash mark).
  • The fifth dot is about one and two-third perpendicular hash marks to the right of the center bottom perpendicular hash mark.
  • The sixth dot is in the same position as the Car Y dot (one and two third perpendicular hash marks to the left of the center bottom hash mark).

(b)

i. Indicate which car, if either, completes one trip around the track in less time, and justify your answer qualitatively without using equations.

ii. Justify your answer about which car, if either, completes one trip around the track in less time quantitatively with appropriate equations.

Car X is shown on the left, and Car Y is shown on the right.

i.

Car X takes longer to accelerate and does not spend any time traveling at top speed. Car Y accelerates over a shorter time and spends time going at top speed. So Car Y must cover the straightaways in a shorter time. Curves take the same time, so Car Y must overall take a shorter time.

ii.

The only difference in the calculations for the time of one segment of linear acceleration is the difference in distances. That shows that Car X takes longer to accelerate. The equation d 4 v c = t c corresponds to Car Y traveling for a time at top speed.

Substituting a = v c t 1 into the displacement equation in part (b) ii gives D = 3 2 v c t 1 . This shows that a car takes less time to reach its maximum speed when it accelerates over a shorter distance. Therefore, Car Y reaches its maximum speed more quickly, and spends more time at its maximum speed than Car X does, as argued in part (b) i.

Got questions? Get instant answers now!

Which of the following is an example of a body exerting a force on itself?

  1. a person standing up from a seated position
  2. a car accelerating while driving
  3. both of the above
  4. none of the above
Got questions? Get instant answers now!

A hawk accelerates as it glides in the air. Does the force causing the acceleration come from the hawk itself? Explain.

A body cannot exert a force on itself. The hawk may accelerate as a result of several forces. The hawk may accelerate toward Earth as a result of the force due to gravity. The hawk may accelerate as a result of the additional force exerted on it by wind. The hawk may accelerate as a result of orienting its body to create less air resistance, thus increasing the net force forward.

Got questions? Get instant answers now!

What causes the force that moves a boat forward when someone rows it?

  1. The force is caused by the rower’s arms.
  2. The force is caused by an interaction between the oars and gravity.
  3. The force is caused by an interaction between the oars and the water the boat is traveling in.
  4. The force is caused by friction.
Got questions? Get instant answers now!

Section summary

  • Dynamics is the study of how forces affect the motion of objects.
  • Force is a push or pull that can be defined in terms of various standards, and it is a vector having both magnitude and direction.
  • External forces are any outside forces that act on a body. A free-body diagram    is a drawing of all external forces acting on a body.

Conceptual questions

Propose a force standard different from the example of a stretched spring discussed in the text. Your standard must be capable of producing the same force repeatedly.

Got questions? Get instant answers now!

What properties do forces have that allow us to classify them as vectors?

Got questions? Get instant answers now!

Questions & Answers

differentiate between demand and supply giving examples
Lambiv Reply
differentiated between demand and supply using examples
Lambiv
what is labour ?
Lambiv
how will I do?
Venny Reply
how is the graph works?I don't fully understand
Rezat Reply
information
Eliyee
devaluation
Eliyee
t
WARKISA
hi guys good evening to all
Lambiv
multiple choice question
Aster Reply
appreciation
Eliyee
explain perfect market
Lindiwe Reply
In economics, a perfect market refers to a theoretical construct where all participants have perfect information, goods are homogenous, there are no barriers to entry or exit, and prices are determined solely by supply and demand. It's an idealized model used for analysis,
Ezea
What is ceteris paribus?
Shukri Reply
other things being equal
AI-Robot
When MP₁ becomes negative, TP start to decline. Extuples Suppose that the short-run production function of certain cut-flower firm is given by: Q=4KL-0.6K2 - 0.112 • Where is quantity of cut flower produced, I is labour input and K is fixed capital input (K-5). Determine the average product of lab
Kelo
Extuples Suppose that the short-run production function of certain cut-flower firm is given by: Q=4KL-0.6K2 - 0.112 • Where is quantity of cut flower produced, I is labour input and K is fixed capital input (K-5). Determine the average product of labour (APL) and marginal product of labour (MPL)
Kelo
yes,thank you
Shukri
Can I ask you other question?
Shukri
what is monopoly mean?
Habtamu Reply
What is different between quantity demand and demand?
Shukri Reply
Quantity demanded refers to the specific amount of a good or service that consumers are willing and able to purchase at a give price and within a specific time period. Demand, on the other hand, is a broader concept that encompasses the entire relationship between price and quantity demanded
Ezea
ok
Shukri
how do you save a country economic situation when it's falling apart
Lilia Reply
what is the difference between economic growth and development
Fiker Reply
Economic growth as an increase in the production and consumption of goods and services within an economy.but Economic development as a broader concept that encompasses not only economic growth but also social & human well being.
Shukri
production function means
Jabir
What do you think is more important to focus on when considering inequality ?
Abdisa Reply
any question about economics?
Awais Reply
sir...I just want to ask one question... Define the term contract curve? if you are free please help me to find this answer 🙏
Asui
it is a curve that we get after connecting the pareto optimal combinations of two consumers after their mutually beneficial trade offs
Awais
thank you so much 👍 sir
Asui
In economics, the contract curve refers to the set of points in an Edgeworth box diagram where both parties involved in a trade cannot be made better off without making one of them worse off. It represents the Pareto efficient allocations of goods between two individuals or entities, where neither p
Cornelius
In economics, the contract curve refers to the set of points in an Edgeworth box diagram where both parties involved in a trade cannot be made better off without making one of them worse off. It represents the Pareto efficient allocations of goods between two individuals or entities,
Cornelius
Suppose a consumer consuming two commodities X and Y has The following utility function u=X0.4 Y0.6. If the price of the X and Y are 2 and 3 respectively and income Constraint is birr 50. A,Calculate quantities of x and y which maximize utility. B,Calculate value of Lagrange multiplier. C,Calculate quantities of X and Y consumed with a given price. D,alculate optimum level of output .
Feyisa Reply
Answer
Feyisa
c
Jabir
the market for lemon has 10 potential consumers, each having an individual demand curve p=101-10Qi, where p is price in dollar's per cup and Qi is the number of cups demanded per week by the i th consumer.Find the market demand curve using algebra. Draw an individual demand curve and the market dema
Gsbwnw Reply
suppose the production function is given by ( L, K)=L¼K¾.assuming capital is fixed find APL and MPL. consider the following short run production function:Q=6L²-0.4L³ a) find the value of L that maximizes output b)find the value of L that maximizes marginal product
Abdureman
types of unemployment
Yomi Reply
What is the difference between perfect competition and monopolistic competition?
Mohammed
Got questions? Join the online conversation and get instant answers!
Jobilize.com Reply
Practice Key Terms 4

Get Jobilize Job Search Mobile App in your pocket Now!

Get it on Google Play Download on the App Store Now


Source:  OpenStax, College physics for ap® courses. OpenStax CNX. Nov 04, 2016 Download for free at https://legacy.cnx.org/content/col11844/1.14
Google Play and the Google Play logo are trademarks of Google Inc.

Notification Switch

Would you like to follow the 'College physics for ap® courses' conversation and receive update notifications?

Ask