<< Chapter < Page Chapter >> Page >

Making connections: take-home experiment—electrical energy use inventory

1) Make a list of the power ratings on a range of appliances in your home or room. Explain why something like a toaster has a higher rating than a digital clock. Estimate the energy consumed by these appliances in an average day (by estimating their time of use). Some appliances might only state the operating current. If the household voltage is 120 V, then use P = IV size 12{P = ital "IV"} {} . 2) Check out the total wattage used in the rest rooms of your school's floor or building. (You might need to assume the long fluorescent lights in use are rated at 32 W.) Suppose that the building was closed all weekend and that these lights were left on from 6 p.m. Friday until 8 a.m. Monday. What would this oversight cost? How about for an entire year of weekends?

Test prep for ap courses

The illustration shows a circuit drawn in a rectangle with a long and short parallel on the left and jagged line resistor labeled R on the right side. To the right of the circuit diagram is a graph with and arrow pointing up on the y axis and labeled E. The horizontal axis is represented by an arrow pointing to the right and labeled t. There is a straight diagonal line originating a the origin labeled 0 and ending at t1 on the x-axis (indicated with a dotted line going from t1 to the tip of the line) and E1 on the y-axis (also indicated with a dotted line).

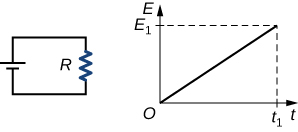
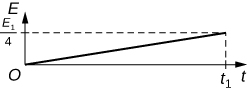
The circuit shown contains a resistor R connected to a voltage supply. The graph shows the total energy 
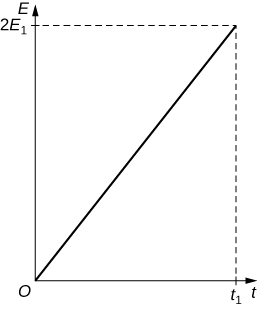
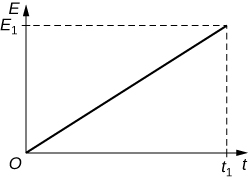
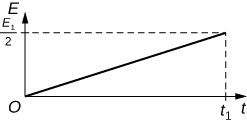
E dissipated by the resistance as a function of time. Which of the following shows the corresponding graph for double resistance, i.e., if R is replaced by 2 R ?

  1. There are four graphs with the same x-axis (t) and y-axis (E) shown in figure Ch20S05. All four graphs have straight, diagonal lines ending at t1 (with a dotted line) on the x-axis. The slopes of the line vary; however because they end at different values on the y-axis. Graph A has the steepest slope and the y-ending value for the line is 2E1. Graph B has the second steepest slope and the y-ending value is E1. Graph C's slope is less steep still and ends at E1 over 2. Graph D has the flattest slop and ends at E1 over 4.
  2. There are four graphs with the same x-axis (t) and y-axis (E) shown in figure Ch20S05. All four graphs have straight, diagonal lines ending at t1 (with a dotted line) on the x-axis. The slopes of the line vary; however because they end at different values on the y-axis. Graph A has the steepest slope and the y-ending value for the line is 2E1. Graph B has the second steepest slope and the y-ending value is E1. Graph C's slope is less steep still and ends at E1 over 2. Graph D has the flattest slop and ends at E1 over 4.
  3. There are four graphs with the same x-axis (t) and y-axis (E) shown in figure Ch20S05. All four graphs have straight, diagonal lines ending at t1 (with a dotted line) on the x-axis. The slopes of the line vary; however because they end at different values on the y-axis. Graph A has the steepest slope and the y-ending value for the line is 2E1. Graph B has the second steepest slope and the y-ending value is E1. Graph C's slope is less steep still and ends at E1 over 2. Graph D has the flattest slop and ends at E1 over 4.
  4. There are four graphs with the same x-axis (t) and y-axis (E) shown in figure Ch20S05. All four graphs have straight, diagonal lines ending at t1 (with a dotted line) on the x-axis. The slopes of the line vary; however because they end at different values on the y-axis. Graph A has the steepest slope and the y-ending value for the line is 2E1. Graph B has the second steepest slope and the y-ending value is E1. Graph C's slope is less steep still and ends at E1 over 2. Graph D has the flattest slop and ends at E1 over 4.
Got questions? Get instant answers now!

What will be the ratio of the resistance of a 120 W, 220 V lamp to that of a 100 W, 110 V lamp?

10:3 or 3.33

Got questions? Get instant answers now!

Section summary

  • Electric power P size 12{P} {} is the rate (in watts) that energy is supplied by a source or dissipated by a device.
  • Three expressions for electrical power are
    P = IV, size 12{P = ital "IV,"} {}
    P = V 2 R , size 12{P = { {V rSup { size 8{2} } } over {R} } ","} {}

    and

    P = I 2 R . size 12{P = I rSup { size 8{2} } R"."} {}
  • The energy used by a device with a power P size 12{P} {} over a time t size 12{t} {} is E = Pt size 12{E = ital "Pt"} {} .

Conceptual questions

Why do incandescent lightbulbs grow dim late in their lives, particularly just before their filaments break?

Got questions? Get instant answers now!

The power dissipated in a resistor is given by P = V 2 / R size 12{P = V rSup { size 8{2} } /R} {} , which means power decreases if resistance increases. Yet this power is also given by P = I 2 R size 12{P = I rSup { size 8{2} } R} {} , which means power increases if resistance increases. Explain why there is no contradiction here.

Got questions? Get instant answers now!

Problem exercises

What is the power of a 1.00 × 10 2 MV lightning bolt having a current of 2.00 × 10 4 A ?

2 . 00 × 10 12 W size 12{2 "." "00"´"10" rSup { size 8{"12"} } " W"} {}

Got questions? Get instant answers now!

What power is supplied to the starter motor of a large truck that draws 250 A of current from a 24.0-V battery hookup?

Got questions? Get instant answers now!

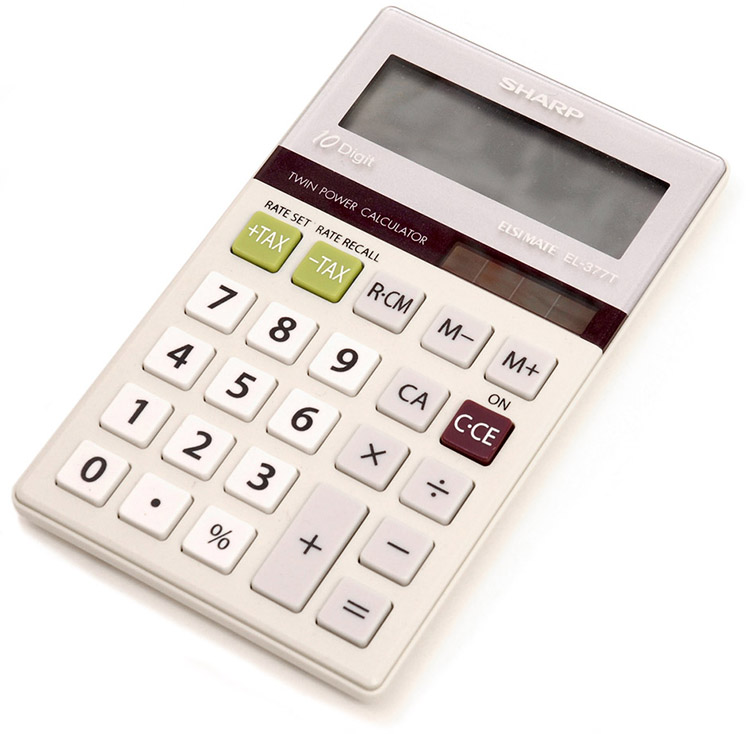
A charge of 4.00 C of charge passes through a pocket calculator's solar cells in 4.00 h. What is the power output, given the calculator's voltage output is 3.00 V? (See [link] .)

Got questions? Get instant answers now!
Photograph of a small calculator having a strip of solar cells just above the keys.
The strip of solar cells just above the keys of this calculator convert light to electricity to supply its energy needs. (credit: Evan-Amos, Wikimedia Commons)

How many watts does a flashlight that has 6.00 × 10 2 C pass through it in 0.500 h use if its voltage is 3.00 V?

Got questions? Get instant answers now!

Find the power dissipated in each of these extension cords: (a) an extension cord having a 0 . 0600 - Ω size 12{0 "." "0600-" %OMEGA } {} resistance and through which 5.00 A is flowing; (b) a cheaper cord utilizing thinner wire and with a resistance of 0 . 300 Ω . size 12{0 "." "300" %OMEGA } {}

(a) 1.50 W

(b) 7.50 W

Got questions? Get instant answers now!

Verify that the units of a volt-ampere are watts, as implied by the equation P = IV size 12{P = ital "IV"} {} .

Got questions? Get instant answers now!

Show that the units 1 V 2 / Ω = 1 W size 12{1" V" rSup { size 8{2} } / %OMEGA =1" W"} {} , as implied by the equation P = V 2 / R size 12{P = V rSup { size 8{2} } /R} {} .

V 2 Ω = V 2 V/A = AV = C s J C = J s = 1 W

Got questions? Get instant answers now!

Show that the units 1 A 2 Ω = 1 W size 12{1" V" rSup { size 8{2} } / %OMEGA =1" W"} {} , as implied by the equation P = I 2 R size 12{P = I rSup { size 8{2} } R} {} .

Got questions? Get instant answers now!

Verify the energy unit equivalence that 1 kW h = 3 . 60 × 10 6 J size 12{1" kW" cdot "h = 3" "." "60"´"10" rSup { size 8{6} } " J"} {} .

1 kW h= 1 × 10 3 J 1 s 1 h 3600 s 1 h = 3 . 60 × 10 6 J size 12{1" kW" cdot "h=" left ( { {1 times "10" rSup { size 8{3} } " J"} over {"1 s"} } right ) left (1" h" right ) left ( { {"3600"" s"} over {"1 h"} } right )=3 "." "60" times "10" rSup { size 8{6} } " J"} {}

Got questions? Get instant answers now!

Questions & Answers

differentiate between demand and supply giving examples
Lambiv Reply
differentiated between demand and supply using examples
Lambiv
what is labour ?
Lambiv
how will I do?
Venny Reply
how is the graph works?I don't fully understand
Rezat Reply
information
Eliyee
devaluation
Eliyee
t
WARKISA
hi guys good evening to all
Lambiv
multiple choice question
Aster Reply
appreciation
Eliyee
explain perfect market
Lindiwe Reply
In economics, a perfect market refers to a theoretical construct where all participants have perfect information, goods are homogenous, there are no barriers to entry or exit, and prices are determined solely by supply and demand. It's an idealized model used for analysis,
Ezea
What is ceteris paribus?
Shukri Reply
other things being equal
AI-Robot
When MP₁ becomes negative, TP start to decline. Extuples Suppose that the short-run production function of certain cut-flower firm is given by: Q=4KL-0.6K2 - 0.112 • Where is quantity of cut flower produced, I is labour input and K is fixed capital input (K-5). Determine the average product of lab
Kelo
Extuples Suppose that the short-run production function of certain cut-flower firm is given by: Q=4KL-0.6K2 - 0.112 • Where is quantity of cut flower produced, I is labour input and K is fixed capital input (K-5). Determine the average product of labour (APL) and marginal product of labour (MPL)
Kelo
yes,thank you
Shukri
Can I ask you other question?
Shukri
what is monopoly mean?
Habtamu Reply
What is different between quantity demand and demand?
Shukri Reply
Quantity demanded refers to the specific amount of a good or service that consumers are willing and able to purchase at a give price and within a specific time period. Demand, on the other hand, is a broader concept that encompasses the entire relationship between price and quantity demanded
Ezea
ok
Shukri
how do you save a country economic situation when it's falling apart
Lilia Reply
what is the difference between economic growth and development
Fiker Reply
Economic growth as an increase in the production and consumption of goods and services within an economy.but Economic development as a broader concept that encompasses not only economic growth but also social & human well being.
Shukri
production function means
Jabir
What do you think is more important to focus on when considering inequality ?
Abdisa Reply
any question about economics?
Awais Reply
sir...I just want to ask one question... Define the term contract curve? if you are free please help me to find this answer 🙏
Asui
it is a curve that we get after connecting the pareto optimal combinations of two consumers after their mutually beneficial trade offs
Awais
thank you so much 👍 sir
Asui
In economics, the contract curve refers to the set of points in an Edgeworth box diagram where both parties involved in a trade cannot be made better off without making one of them worse off. It represents the Pareto efficient allocations of goods between two individuals or entities, where neither p
Cornelius
In economics, the contract curve refers to the set of points in an Edgeworth box diagram where both parties involved in a trade cannot be made better off without making one of them worse off. It represents the Pareto efficient allocations of goods between two individuals or entities,
Cornelius
Suppose a consumer consuming two commodities X and Y has The following utility function u=X0.4 Y0.6. If the price of the X and Y are 2 and 3 respectively and income Constraint is birr 50. A,Calculate quantities of x and y which maximize utility. B,Calculate value of Lagrange multiplier. C,Calculate quantities of X and Y consumed with a given price. D,alculate optimum level of output .
Feyisa Reply
Answer
Feyisa
c
Jabir
the market for lemon has 10 potential consumers, each having an individual demand curve p=101-10Qi, where p is price in dollar's per cup and Qi is the number of cups demanded per week by the i th consumer.Find the market demand curve using algebra. Draw an individual demand curve and the market dema
Gsbwnw Reply
suppose the production function is given by ( L, K)=L¼K¾.assuming capital is fixed find APL and MPL. consider the following short run production function:Q=6L²-0.4L³ a) find the value of L that maximizes output b)find the value of L that maximizes marginal product
Abdureman
types of unemployment
Yomi Reply
What is the difference between perfect competition and monopolistic competition?
Mohammed
Got questions? Join the online conversation and get instant answers!
Jobilize.com Reply
Practice Key Terms 1

Get Jobilize Job Search Mobile App in your pocket Now!

Get it on Google Play Download on the App Store Now


Source:  OpenStax, College physics for ap® courses. OpenStax CNX. Nov 04, 2016 Download for free at https://legacy.cnx.org/content/col11844/1.14
Google Play and the Google Play logo are trademarks of Google Inc.

Notification Switch

Would you like to follow the 'College physics for ap® courses' conversation and receive update notifications?

Ask