<< Chapter < Page Chapter >> Page >
Part a of the figure shows a graph for pressure versus volume. The pressure is along the y axis and the volume is along the x axis. There are two curves. The first curve begins at point A and falls smoothly downward to point B. The graph is shown for an isothermal process. The second curve also begins at point A but falls below the first curve and ends at point C vertically below point B. This graph is shown for an adiabatic process. A line joins point B and C to meet on the X axis. Also a line is drawn from point A to meet the X axis. The area under both the curves is shaded. The graph in figure b is similar to the graph in figure a. Only the directions of the curves are changed. The graph begins from A and moves downward to point B. Then from point B the curve drops vertically downward to C. From point C the graph has a smooth rise back to point A. All directions represented using arrows.
(a) The upper curve is an isothermal process ( Δ T = 0 size 12{ΔT=0} {} ), whereas the lower curve is an adiabatic process ( Q = 0 size 12{Q=0} {} ). Both start from the same point A, but the isothermal process does more work than the adiabatic because heat transfer into the gas takes place to keep its temperature constant. This keeps the pressure higher all along the isothermal path than along the adiabatic path, producing more work. The adiabatic path thus ends up with a lower pressure and temperature at point C, even though the final volume is the same as for the isothermal process. (b) The cycle ABCA produces a net work output.

Applying the science practices: work in a potato cannon

Plan an experiment using a potato cannon, meter stick, and pressure gauge to measure the work done by a potato cannon. Your experiment should produce P–V diagrams to analyze and determine the work done on a gas or by a gas. What do you need to measure? How will you measure it? Can you modify the potato cannon to make your measurements easier? When you perform multiple trials, what variables do you need to keep fixed between each trial? Which variables will you change?

One class decides to use a heavy piston, capable of being latched in place, to replace the potato. They latch the piston in place so that the contained volume is 0.50 L, load the cannon with fuel, and close the cannon with their pressure gauge, which reads 101 kPa. Then they light the fuel, and the pressure jumps to 405 kPa. Next, they release the latch, and the piston moves out until the internal volume is 2.0 L. The pressure is measured at this point to be 101 kPa again. Finally, they release the pressure gauge, and move the piston back down to 0.50 L, still at atmospheric pressure. Draw a diagram of this process, and calculate the net work performed by this system. Can you think of any ways to improve the measurements?

You should find that you have a right triangle on a P–V diagram, the area of which is the net work done by the system. Using a pressure gauge that can take continuous measurements during the expansion phase might be useful, as it is unlikely that this would actually be a linear process.

Reversible processes

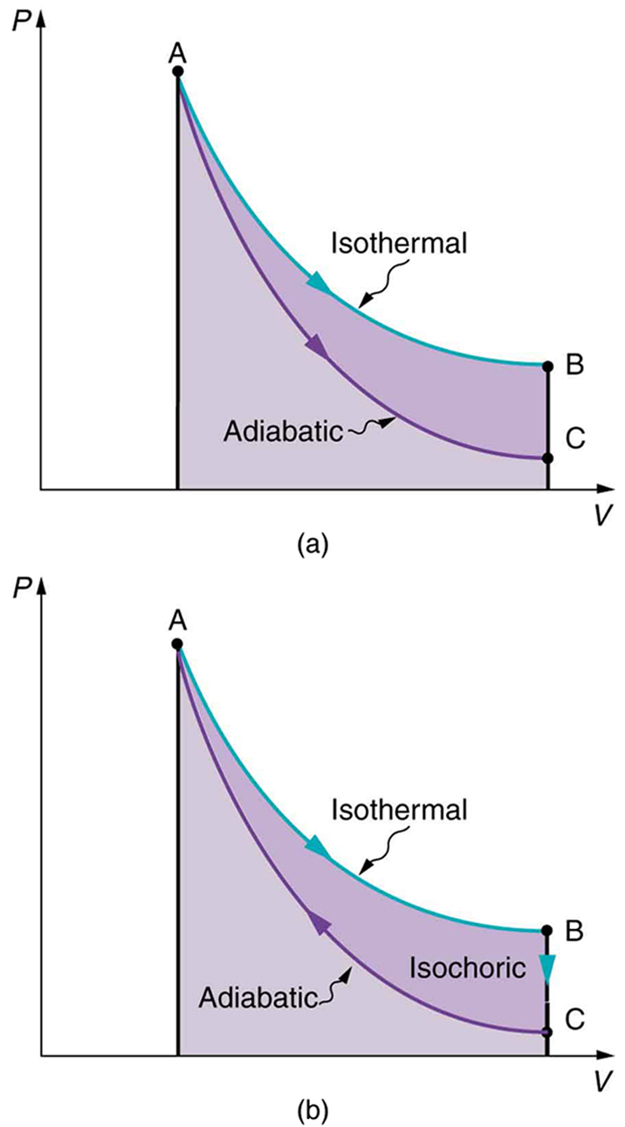
Both isothermal and adiabatic processes such as shown in [link] are reversible in principle. A reversible process    is one in which both the system and its environment can return to exactly the states they were in by following the reverse path. The reverse isothermal and adiabatic paths are BA and CA, respectively. Real macroscopic processes are never exactly reversible. In the previous examples, our system is a gas (like that in [link] ), and its environment is the piston, cylinder, and the rest of the universe. If there are any energy-dissipating mechanisms, such as friction or turbulence, then heat transfer to the environment occurs for either direction of the piston. So, for example, if the path BA is followed and there is friction, then the gas will be returned to its original state but the environment will not—it will have been heated in both directions. Reversibility requires the direction of heat transfer to reverse for the reverse path. Since dissipative mechanisms cannot be completely eliminated, real processes cannot be reversible.

Questions & Answers

how do you get the 2/50
Abba Reply
number of sport play by 50 student construct discrete data
Aminu Reply
width of the frangebany leaves on how to write a introduction
Theresa Reply
Solve the mean of variance
Veronica Reply
Step 1: Find the mean. To find the mean, add up all the scores, then divide them by the number of scores. ... Step 2: Find each score's deviation from the mean. ... Step 3: Square each deviation from the mean. ... Step 4: Find the sum of squares. ... Step 5: Divide the sum of squares by n – 1 or N.
kenneth
what is error
Yakuba Reply
Is mistake done to something
Vutshila
Hy
anas
hy
What is the life teble
anas
hy
Jibrin
statistics is the analyzing of data
Tajudeen Reply
what is statics?
Zelalem Reply
how do you calculate mean
Gloria Reply
diveving the sum if all values
Shaynaynay
let A1,A2 and A3 events be independent,show that (A1)^c, (A2)^c and (A3)^c are independent?
Fisaye Reply
what is statistics
Akhisani Reply
data collected all over the world
Shaynaynay
construct a less than and more than table
Imad Reply
The sample of 16 students is taken. The average age in the sample was 22 years with astandard deviation of 6 years. Construct a 95% confidence interval for the age of the population.
Aschalew Reply
Bhartdarshan' is an internet-based travel agency wherein customer can see videos of the cities they plant to visit. The number of hits daily is a normally distributed random variable with a mean of 10,000 and a standard deviation of 2,400 a. what is the probability of getting more than 12,000 hits? b. what is the probability of getting fewer than 9,000 hits?
Akshay Reply
Bhartdarshan'is an internet-based travel agency wherein customer can see videos of the cities they plan to visit. The number of hits daily is a normally distributed random variable with a mean of 10,000 and a standard deviation of 2,400. a. What is the probability of getting more than 12,000 hits
Akshay
1
Bright
Sorry i want to learn more about this question
Bright
Someone help
Bright
a= 0.20233 b=0.3384
Sufiyan
a
Shaynaynay
How do I interpret level of significance?
Mohd Reply
It depends on your business problem or in Machine Learning you could use ROC- AUC cruve to decide the threshold value
Shivam
how skewness and kurtosis are used in statistics
Owen Reply
yes what is it
Taneeya
Got questions? Join the online conversation and get instant answers!
Jobilize.com Reply
Practice Key Terms 6

Get Jobilize Job Search Mobile App in your pocket Now!

Get it on Google Play Download on the App Store Now


Source:  OpenStax, College physics for ap® courses. OpenStax CNX. Nov 04, 2016 Download for free at https://legacy.cnx.org/content/col11844/1.14
Google Play and the Google Play logo are trademarks of Google Inc.

Notification Switch

Would you like to follow the 'College physics for ap® courses' conversation and receive update notifications?

Ask