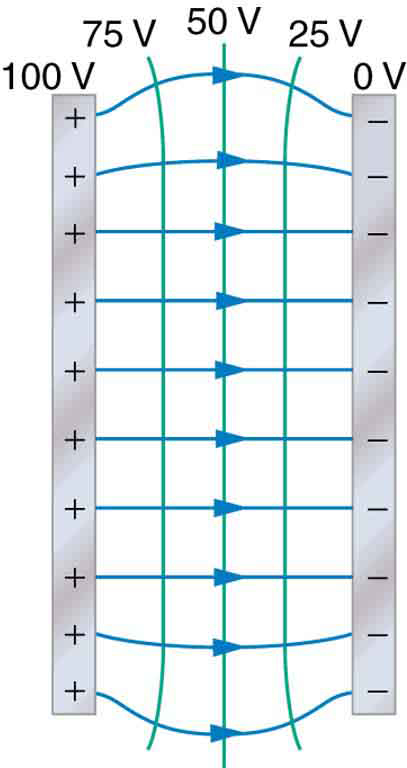
The electric field and equipotential lines between two metal plates.
Making connections: slopes and parallel plates
Consider the parallel plates in
[link] . These have equipotential lines that are parallel to the plates in the space between, and evenly spaced. An example of this (with sample values) is given in
[link] . One could draw a similar set of equipotential isolines for gravity on the hill shown in
[link] . If the hill has any extent at the same slope, the isolines along that extent would be parallel to each other. Furthermore, in regions of constant slope, the isolines would be evenly spaced.
Note that a topographical map along a ridge has roughly parallel elevation lines, similar to the equipotential lines in
[link] .
An important application of electric fields and equipotential lines involves the heart. The heart relies on electrical signals to maintain its rhythm. The movement of electrical signals causes the chambers of the heart to contract and relax. When a person has a heart attack, the movement of these electrical signals may be disturbed. An artificial pacemaker and a defibrillator can be used to initiate the rhythm of electrical signals. The equipotential lines around the heart, the thoracic region, and the axis of the heart are useful ways of monitoring the structure and functions of the heart. An electrocardiogram (ECG) measures the small electric signals being generated during the activity of the heart. More about the relationship between electric fields and the heart is discussed in
Energy Stored in Capacitors .
Phet explorations: charges and fields
Move point charges around on the playing field and then view the electric field, voltages, equipotential lines, and more. It's colorful, it's dynamic, it's free.
Consider two conducting plates, placed on adjacent sides of a square, but with a 1-m space between the corner of the square and the plate. These plates are not touching, not centered on each other, but are at right angles. Each plate is 1 m wide. If the plates are held at a fixed potential difference Δ
V , draw the equipotential lines for this system.
As isolines of electric potential get closer together, the electric field gets stronger. What shape would a hill have as the isolines of gravitational potential get closer together?
Consider two conducting plates, placed on adjacent sides of a square, but with a 1-m space between the corner of the square and the plate. These plates are not touching, not centered on each other, but are at right angles. Each plate is 1 m wide. If the plates are held at a fixed potential difference Δ
V , sketch the path of both a positively charged object placed between the near ends, and a negatively charged object placed near the open ends.
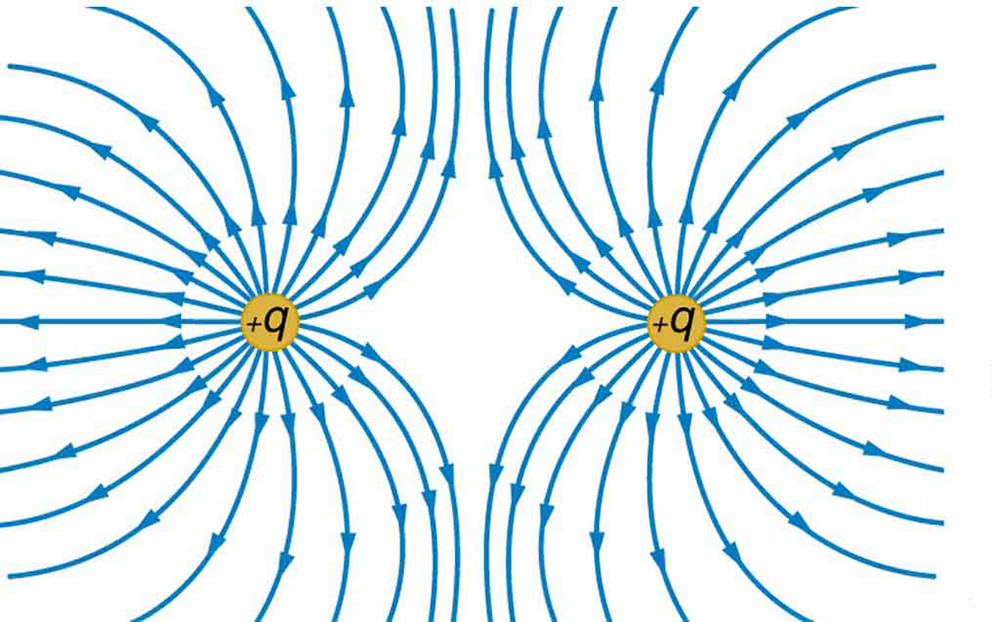
[link] shows the electric field lines near two charges
and
, the first having a magnitude four times that of the second. Sketch the equipotential lines for these two charges, and indicate the direction of increasing potential.
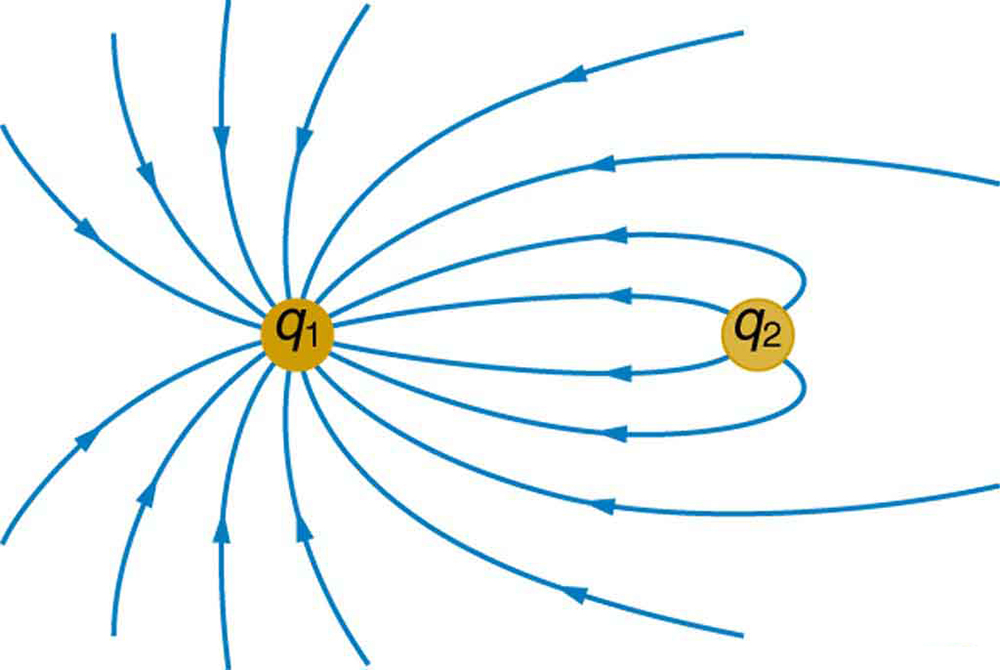
Sketch the equipotential lines in the vicinity of two opposite charges, where the negative charge is three times as great in magnitude as the positive. See
[link] for a similar situation. Indicate the direction of increasing potential.
Sketch the equipotential lines in the vicinity of the negatively charged conductor in
[link] . How will these equipotentials look a long distance from the object?
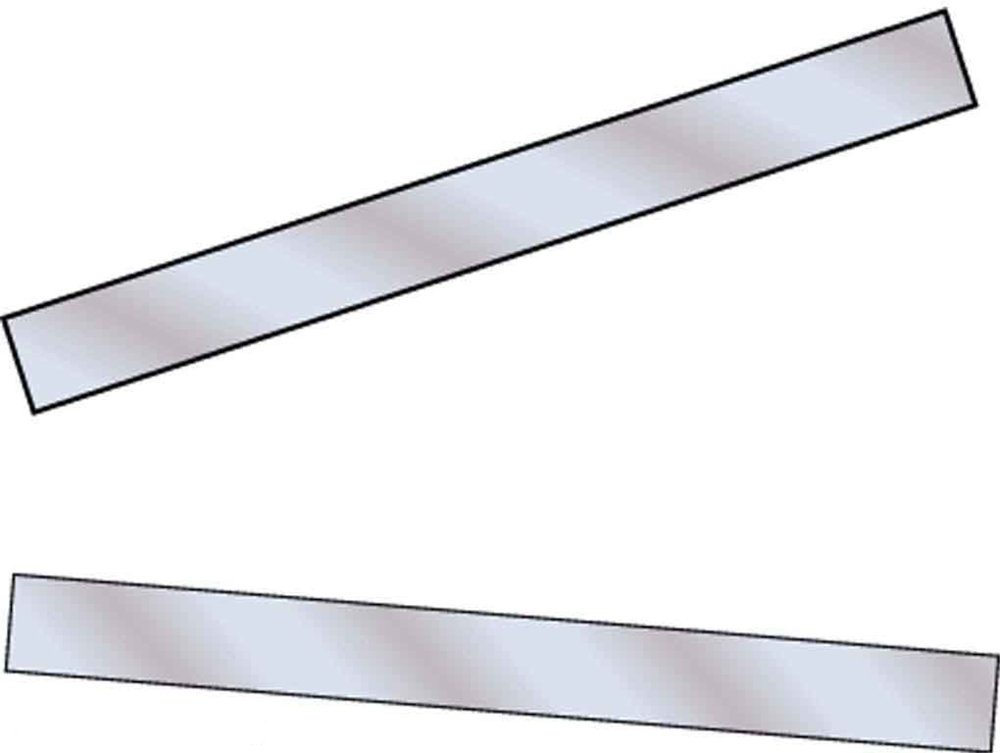
Sketch the equipotential lines surrounding the two conducting plates shown in
[link] , given the top plate is positive and the bottom plate has an equal amount of negative charge. Be certain to indicate the distribution of charge on the plates. Is the field strongest where the plates are closest? Why should it be?
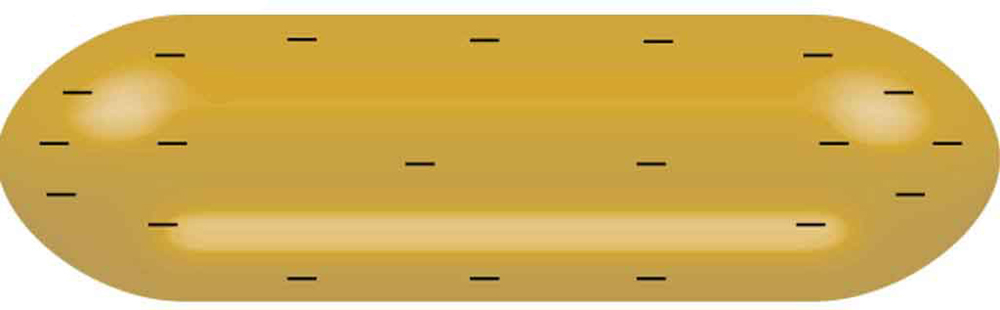
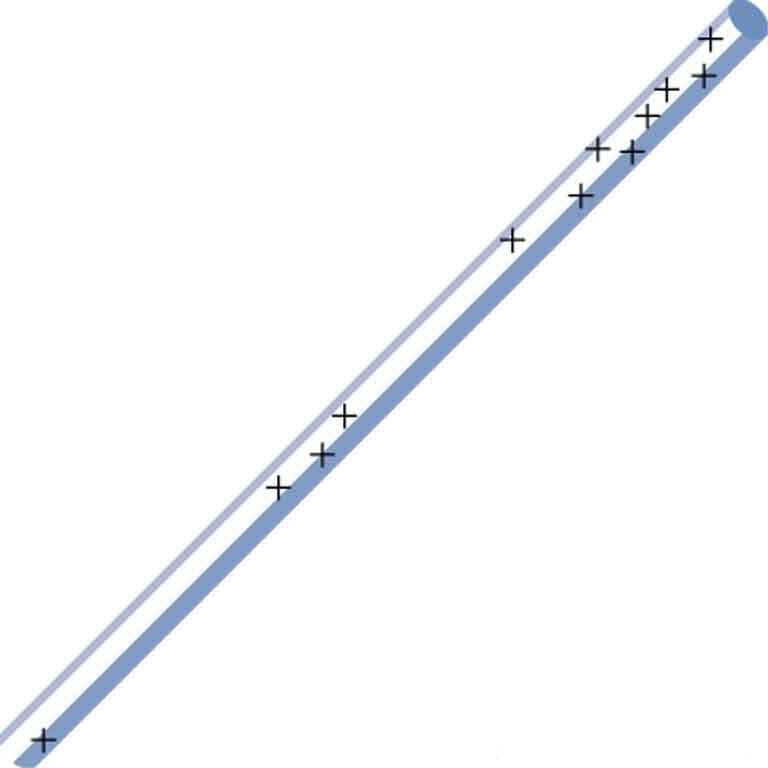
(a) Sketch the electric field lines in the vicinity of the charged insulator in
[link] . Note its non-uniform charge distribution. (b) Sketch equipotential lines surrounding the insulator. Indicate the direction of increasing potential.
A charged insulating rod such as might be used in a classroom demonstration.
The naturally occurring charge on the ground on a fine day out in the open country is
. (a) What is the electric field relative to ground at a height of 3.00 m? (b) Calculate the electric potential at this height. (c) Sketch electric field and equipotential lines for this scenario.
The lesser electric ray (
Narcine bancroftii )
maintains an incredible charge on its head and a charge equal in magnitude but opposite in sign on its tail (
[link] ). (a) Sketch the equipotential lines surrounding the ray. (b) Sketch the equipotentials when the ray is near a ship with a conducting surface. (c) How could this charge distribution be of use to the ray?
Lesser electric ray (
Narcine bancroftii ) (credit: National Oceanic and Atmospheric Administration, NOAA's Fisheries Collection).
In economics, a perfect market refers to a theoretical construct where all participants have perfect information, goods are homogenous, there are no barriers to entry or exit, and prices are determined solely by supply and demand. It's an idealized model used for analysis,
When MP₁ becomes negative, TP start to decline.
Extuples Suppose that the short-run production function of certain cut-flower firm is given by: Q=4KL-0.6K2 - 0.112 •
Where is quantity of cut flower produced, I is labour input and K is fixed capital input (K-5). Determine the average product of lab
Kelo
Extuples Suppose that the short-run production function of certain cut-flower firm is given by: Q=4KL-0.6K2 - 0.112 •
Where is quantity of cut flower produced, I is labour input and K is fixed capital input (K-5). Determine the average product of labour (APL) and marginal product of labour (MPL)
Quantity demanded refers to the specific amount of a good or service that consumers are willing and able to purchase at a give price and within a specific time period. Demand, on the other hand, is a broader concept that encompasses the entire relationship between price and quantity demanded
Ezea
ok
Shukri
how do you save a country economic situation when it's falling apart
Economic growth as an increase in the production and consumption of goods and services within an economy.but
Economic development as a broader concept that encompasses not only economic growth but also social & human well being.
Shukri
production function means
Jabir
What do you think is more important to focus on when considering inequality ?
sir...I just want to ask one question... Define the term contract curve? if you are free please help me to find this answer 🙏
Asui
it is a curve that we get after connecting the pareto optimal combinations of two consumers after their mutually beneficial trade offs
Awais
thank you so much 👍 sir
Asui
In economics, the contract curve refers to the set of points in an Edgeworth box diagram where both parties involved in a trade cannot be made better off without making one of them worse off. It represents the Pareto efficient allocations of goods between two individuals or entities, where neither p
Cornelius
In economics, the contract curve refers to the set of points in an Edgeworth box diagram where both parties involved in a trade cannot be made better off without making one of them worse off. It represents the Pareto efficient allocations of goods between two individuals or entities,
Cornelius
Suppose a consumer consuming two commodities X and Y has
The following utility function u=X0.4 Y0.6. If the price of the X and Y are 2 and 3 respectively and income Constraint is birr 50.
A,Calculate quantities of x and y which maximize utility.
B,Calculate value of Lagrange multiplier.
C,Calculate quantities of X and Y consumed with a given price.
D,alculate optimum level of output .
the market for lemon has 10 potential consumers, each having an individual demand curve p=101-10Qi, where p is price in dollar's per cup and Qi is the number of cups demanded per week by the i th consumer.Find the market demand curve using algebra. Draw an individual demand curve and the market dema
suppose the production function is given by ( L, K)=L¼K¾.assuming capital is fixed find APL and MPL. consider the following short run production function:Q=6L²-0.4L³ a) find the value of L that maximizes output b)find the value of L that maximizes marginal product