Explain the differences among the simple thermodynamic processes—isobaric, isochoric, isothermal, and adiabatic.
Calculate total work done in a cyclical thermodynamic process.
The information presented in this section supports the following AP® learning objectives and science practices:
5.B.5.6 The student is able to design an experiment and analyze graphical data in which interpretations of the area under a pressure-volume curve are needed to determine the work done on or by the object or system.
(S.P. 4.2, 5.1)
5.B.7.2 The student is able to create a plot of pressure versus volume for a thermodynamic process from given data.
(S.P. 1.1)
5.B.7.3 The student is able to use a plot of pressure versus volume for a thermodynamic process to make calculations of internal energy changes, heat, or work, based upon conservation of energy principles (i.e., the first law of thermodynamics).
(S.P. 1.1, 1.4, 2.2)
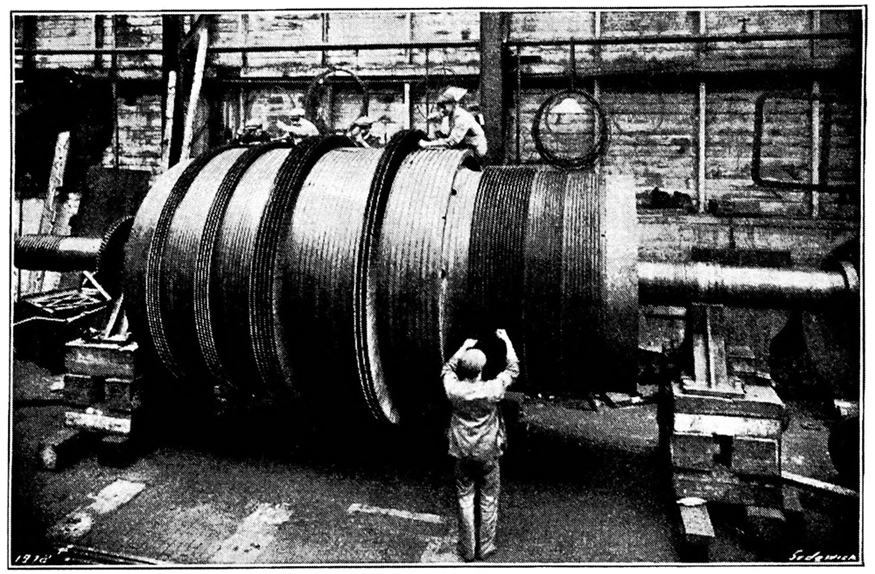
Beginning with the Industrial Revolution, humans have harnessed power through the use of the first law of thermodynamics, before we even understood it completely. This photo, of a steam engine at the Turbinia Works, dates from 1911, a mere 61 years after the first explicit statement of the first law of thermodynamics by Rudolph Clausius. (credit: public domain; author unknown)
One of the most important things we can do with heat transfer is to use it to do work for us. Such a device is called a
heat engine . Car engines and steam turbines that generate electricity are examples of heat engines.
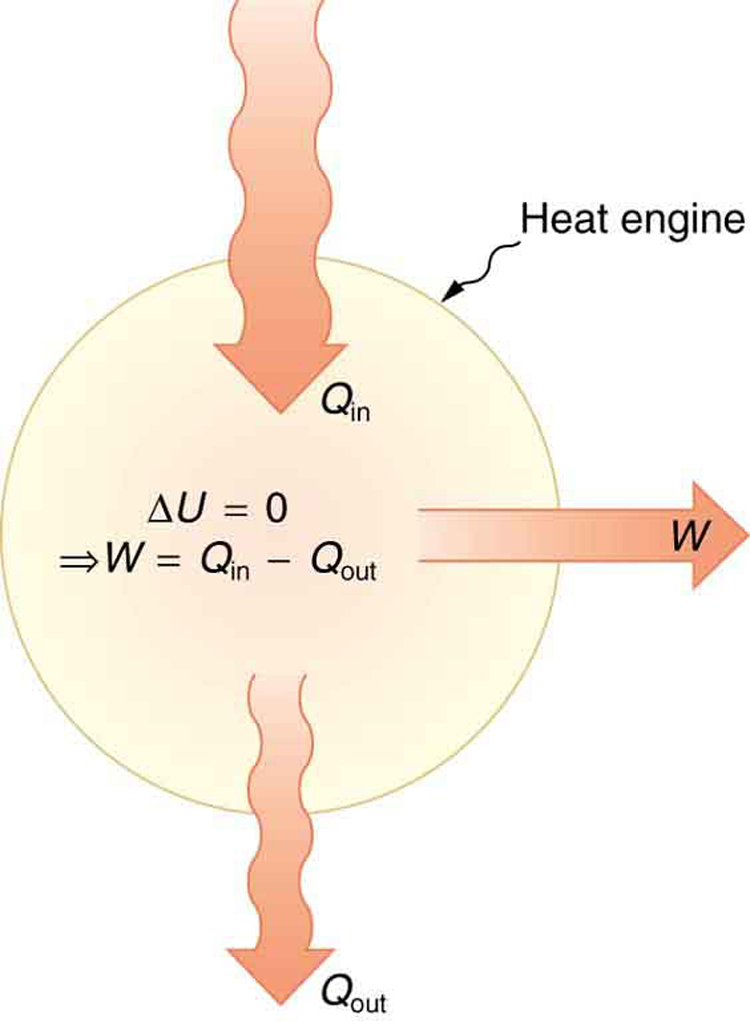
[link] shows schematically how the first law of thermodynamics applies to the typical heat engine.
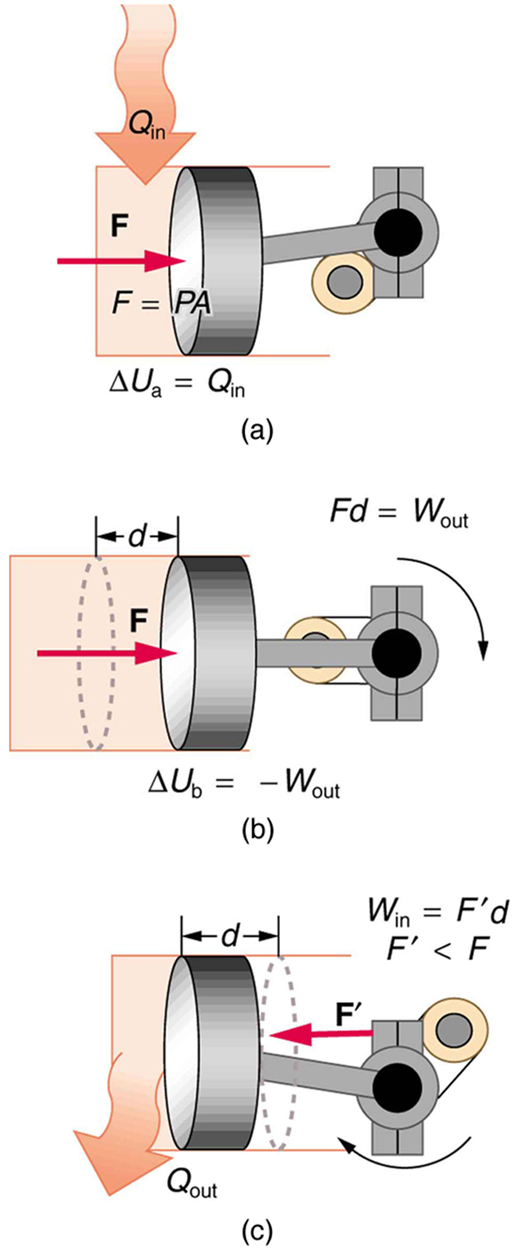
Schematic representation of a heat engine, governed, of course, by the first law of thermodynamics. It is impossible to devise a system where
, that is, in which no heat transfer occurs to the environment.(a) Heat transfer to the gas in a cylinder increases the internal energy of the gas, creating higher pressure and temperature. (b) The force exerted on the movable cylinder does work as the gas expands. Gas pressure and temperature decrease when it expands, indicating that the gas's internal energy has been decreased by doing work. (c) Heat transfer to the environment further reduces pressure in the gas so that the piston can be more easily returned to its starting position.
The illustrations above show one of the ways in which heat transfer does work. Fuel combustion produces heat transfer to a gas in a cylinder, increasing the pressure of the gas and thereby the force it exerts on a movable piston. The gas does work on the outside world, as this force moves the piston through some distance. Heat transfer to the gas cylinder results in work being done. To repeat this process, the piston needs to be returned to its starting point. Heat transfer now occurs from the gas to the surroundings so that its pressure decreases, and a force is exerted by the surroundings to push the piston back through some distance. Variations of this process are employed daily in hundreds of millions of heat engines. We will examine heat engines in detail in the next section. In this section, we consider some of the simpler underlying processes on which heat engines are based.
Questions & Answers
differentiate between demand and supply
giving examples
In economics, a perfect market refers to a theoretical construct where all participants have perfect information, goods are homogenous, there are no barriers to entry or exit, and prices are determined solely by supply and demand. It's an idealized model used for analysis,
When MP₁ becomes negative, TP start to decline.
Extuples Suppose that the short-run production function of certain cut-flower firm is given by: Q=4KL-0.6K2 - 0.112 •
Where is quantity of cut flower produced, I is labour input and K is fixed capital input (K-5). Determine the average product of lab
Kelo
Extuples Suppose that the short-run production function of certain cut-flower firm is given by: Q=4KL-0.6K2 - 0.112 •
Where is quantity of cut flower produced, I is labour input and K is fixed capital input (K-5). Determine the average product of labour (APL) and marginal product of labour (MPL)
Quantity demanded refers to the specific amount of a good or service that consumers are willing and able to purchase at a give price and within a specific time period. Demand, on the other hand, is a broader concept that encompasses the entire relationship between price and quantity demanded
Ezea
ok
Shukri
how do you save a country economic situation when it's falling apart
Economic growth as an increase in the production and consumption of goods and services within an economy.but
Economic development as a broader concept that encompasses not only economic growth but also social & human well being.
Shukri
production function means
Jabir
What do you think is more important to focus on when considering inequality ?
sir...I just want to ask one question... Define the term contract curve? if you are free please help me to find this answer 🙏
Asui
it is a curve that we get after connecting the pareto optimal combinations of two consumers after their mutually beneficial trade offs
Awais
thank you so much 👍 sir
Asui
In economics, the contract curve refers to the set of points in an Edgeworth box diagram where both parties involved in a trade cannot be made better off without making one of them worse off. It represents the Pareto efficient allocations of goods between two individuals or entities, where neither p
Cornelius
In economics, the contract curve refers to the set of points in an Edgeworth box diagram where both parties involved in a trade cannot be made better off without making one of them worse off. It represents the Pareto efficient allocations of goods between two individuals or entities,
Cornelius
Suppose a consumer consuming two commodities X and Y has
The following utility function u=X0.4 Y0.6. If the price of the X and Y are 2 and 3 respectively and income Constraint is birr 50.
A,Calculate quantities of x and y which maximize utility.
B,Calculate value of Lagrange multiplier.
C,Calculate quantities of X and Y consumed with a given price.
D,alculate optimum level of output .
the market for lemon has 10 potential consumers, each having an individual demand curve p=101-10Qi, where p is price in dollar's per cup and Qi is the number of cups demanded per week by the i th consumer.Find the market demand curve using algebra. Draw an individual demand curve and the market dema
suppose the production function is given by ( L, K)=L¼K¾.assuming capital is fixed find APL and MPL. consider the following short run production function:Q=6L²-0.4L³ a) find the value of L that maximizes output b)find the value of L that maximizes marginal product