<< Chapter < Page Chapter >> Page >
The diagram shows a schematic representation of a system that goes from state one with entropy S sub one to state two with entropy S sub two. The two states are shown as two circles drawn a distance apart. Two arrows represent two different processes to take the system from state one to state two. A straight arrow pointing from state one to state two shows a reversible process. The change in entropy for this process is given by delta S equals Q divided by T. The second process is marked as a curving arrow from state one to state two, showing an irreversible process. The change in entropy for this process is given by delta S sub irreversible equals delta S sub reversible equals S sub two minus S sub one.
When a system goes from state 1 to state 2, its entropy changes by the same amount Δ S size 12{ΔS} {} , whether a hypothetical reversible path is followed or a real irreversible path is taken.

Now let us take a look at the change in entropy of a Carnot engine and its heat reservoirs for one full cycle. The hot reservoir has a loss of entropy Δ S h = Q h / T h size 12{ΔS rSub { size 8{h} } = - Q rSub { size 8{h} } /T rSub { size 8{h} } } {} , because heat transfer occurs out of it (remember that when heat transfers out, then Q size 12{Q} {} has a negative sign). The cold reservoir has a gain of entropy Δ S c = Q c / T c size 12{ΔS rSub { size 8{c} } =Q rSub { size 8{c} } /T rSub { size 8{c} } } {} , because heat transfer occurs into it. (We assume the reservoirs are sufficiently large that their temperatures are constant.) So the total change in entropy is

Δ S tot = Δ S h + Δ S c . size 12{DS rSub { size 8{"tot"} } =DS rSub { size 8{h} } +DS rSub { size 8{c} } "." } {}

Thus, since we know that Q h / T h = Q c / T c size 12{Q rSub { size 8{h} } /T rSub { size 8{h} } =Q rSub { size 8{c} } /T rSub { size 8{c} } } {} for a Carnot engine,

Δ S tot =– Q h T h + Q c T c = 0 . size 12{DS rSub { size 8{"tot"} } "=-" { {Q rSub { size 8{h} } } over {T rSub { size 8{h} } } } + { {Q rSub { size 8{c} } } over {T rSub { size 8{c} } } } =0 "." } {}

This result, which has general validity, means that the total change in entropy for a system in any reversible process is zero.

The entropy of various parts of the system may change, but the total change is zero. Furthermore, the system does not affect the entropy of its surroundings, since heat transfer between them does not occur. Thus the reversible process changes neither the total entropy of the system nor the entropy of its surroundings. Sometimes this is stated as follows: Reversible processes do not affect the total entropy of the universe. Real processes are not reversible, though, and they do change total entropy. We can, however, use hypothetical reversible processes to determine the value of entropy in real, irreversible processes. The following example illustrates this point.

Entropy increases in an irreversible (real) process

Spontaneous heat transfer from hot to cold is an irreversible process. Calculate the total change in entropy if 4000 J of heat transfer occurs from a hot reservoir at T h = 600 K 327º C size 12{T rSub { size 8{h} } ="600"" K " left ("327"°C right )} {} to a cold reservoir at T c = 250 K 23º C size 12{T rSub { size 8{c} } ="250"" K " left (-"23" "." 0°C right )} {} , assuming there is no temperature change in either reservoir. (See [link] .)

Strategy

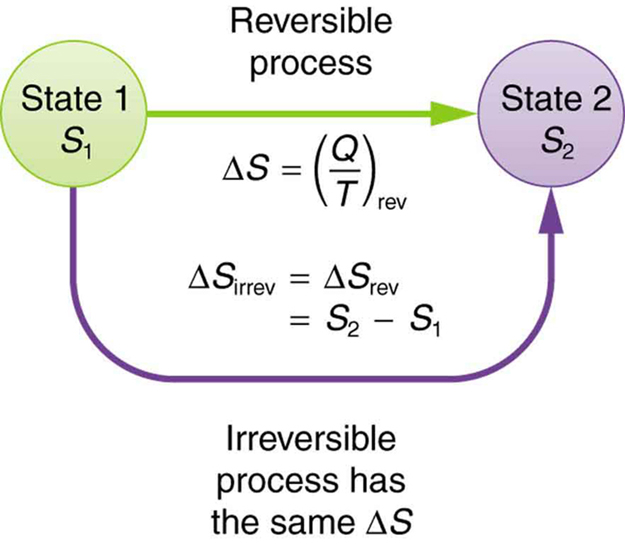
How can we calculate the change in entropy for an irreversible process when Δ S tot = Δ S h + Δ S c size 12{ΔS rSub { size 8{"tot"} } =ΔS rSub { size 8{h} } +ΔS rSub { size 8{c} } } {} is valid only for reversible processes? Remember that the total change in entropy of the hot and cold reservoirs will be the same whether a reversible or irreversible process is involved in heat transfer from hot to cold. So we can calculate the change in entropy of the hot reservoir for a hypothetical reversible process in which 4000 J of heat transfer occurs from it; then we do the same for a hypothetical reversible process in which 4000 J of heat transfer occurs to the cold reservoir. This produces the same changes in the hot and cold reservoirs that would occur if the heat transfer were allowed to occur irreversibly between them, and so it also produces the same changes in entropy.

Solution

We now calculate the two changes in entropy using Δ S tot = Δ S h + Δ S c size 12{DS rSub { size 8{"tot"} } =DS rSub { size 8{h} } +DS rSub { size 8{c} } } {} . First, for the heat transfer from the hot reservoir,

Δ S h = Q h T h = 4000 J 600 K = 6 . 67 J/K . size 12{DS rSub { size 8{h} } = { {-Q rSub { size 8{h} } } over {T rSub { size 8{h} } } } = { {-"4000"" J"} over {"600 K"} } "=-"6 "." "67"" J/K"} {}

And for the cold reservoir,

Δ S c = Q c T c = 4000 J 250 K = 16 . 0 J/K . size 12{DS rSub { size 8{c} } = { {-Q rSub { size 8{c} } } over {T rSub { size 8{c} } } } = { {"4000"" J"} over {"250 K"} } ="16" "." 0" J/K"} {}

Thus the total is

Δ S tot = Δ S h + Δ S c = ( 6 . 67 +16 . 0 ) J/K = 9.33 J/K. alignl { stack { size 12{DS rSub { size 8{"tot"} } =DS rSub { size 8{h} } +DS rSub { size 8{c} } } {} #" =" \( +- 6 "." "67 +16" "." 0 \) " J/K" {} # " =9" "." "33 J/K" "." {}} } {}

Discussion

There is an increase in entropy for the system of two heat reservoirs undergoing this irreversible heat transfer. We will see that this means there is a loss of ability to do work with this transferred energy. Entropy has increased, and energy has become unavailable to do work.

Questions & Answers

differentiate between demand and supply giving examples
Lambiv Reply
differentiated between demand and supply using examples
Lambiv
what is labour ?
Lambiv
how will I do?
Venny Reply
how is the graph works?I don't fully understand
Rezat Reply
information
Eliyee
devaluation
Eliyee
t
WARKISA
hi guys good evening to all
Lambiv
multiple choice question
Aster Reply
appreciation
Eliyee
explain perfect market
Lindiwe Reply
In economics, a perfect market refers to a theoretical construct where all participants have perfect information, goods are homogenous, there are no barriers to entry or exit, and prices are determined solely by supply and demand. It's an idealized model used for analysis,
Ezea
What is ceteris paribus?
Shukri Reply
other things being equal
AI-Robot
When MP₁ becomes negative, TP start to decline. Extuples Suppose that the short-run production function of certain cut-flower firm is given by: Q=4KL-0.6K2 - 0.112 • Where is quantity of cut flower produced, I is labour input and K is fixed capital input (K-5). Determine the average product of lab
Kelo
Extuples Suppose that the short-run production function of certain cut-flower firm is given by: Q=4KL-0.6K2 - 0.112 • Where is quantity of cut flower produced, I is labour input and K is fixed capital input (K-5). Determine the average product of labour (APL) and marginal product of labour (MPL)
Kelo
yes,thank you
Shukri
Can I ask you other question?
Shukri
what is monopoly mean?
Habtamu Reply
What is different between quantity demand and demand?
Shukri Reply
Quantity demanded refers to the specific amount of a good or service that consumers are willing and able to purchase at a give price and within a specific time period. Demand, on the other hand, is a broader concept that encompasses the entire relationship between price and quantity demanded
Ezea
ok
Shukri
how do you save a country economic situation when it's falling apart
Lilia Reply
what is the difference between economic growth and development
Fiker Reply
Economic growth as an increase in the production and consumption of goods and services within an economy.but Economic development as a broader concept that encompasses not only economic growth but also social & human well being.
Shukri
production function means
Jabir
What do you think is more important to focus on when considering inequality ?
Abdisa Reply
any question about economics?
Awais Reply
sir...I just want to ask one question... Define the term contract curve? if you are free please help me to find this answer 🙏
Asui
it is a curve that we get after connecting the pareto optimal combinations of two consumers after their mutually beneficial trade offs
Awais
thank you so much 👍 sir
Asui
In economics, the contract curve refers to the set of points in an Edgeworth box diagram where both parties involved in a trade cannot be made better off without making one of them worse off. It represents the Pareto efficient allocations of goods between two individuals or entities, where neither p
Cornelius
In economics, the contract curve refers to the set of points in an Edgeworth box diagram where both parties involved in a trade cannot be made better off without making one of them worse off. It represents the Pareto efficient allocations of goods between two individuals or entities,
Cornelius
Suppose a consumer consuming two commodities X and Y has The following utility function u=X0.4 Y0.6. If the price of the X and Y are 2 and 3 respectively and income Constraint is birr 50. A,Calculate quantities of x and y which maximize utility. B,Calculate value of Lagrange multiplier. C,Calculate quantities of X and Y consumed with a given price. D,alculate optimum level of output .
Feyisa Reply
Answer
Feyisa
c
Jabir
the market for lemon has 10 potential consumers, each having an individual demand curve p=101-10Qi, where p is price in dollar's per cup and Qi is the number of cups demanded per week by the i th consumer.Find the market demand curve using algebra. Draw an individual demand curve and the market dema
Gsbwnw Reply
suppose the production function is given by ( L, K)=L¼K¾.assuming capital is fixed find APL and MPL. consider the following short run production function:Q=6L²-0.4L³ a) find the value of L that maximizes output b)find the value of L that maximizes marginal product
Abdureman
types of unemployment
Yomi Reply
What is the difference between perfect competition and monopolistic competition?
Mohammed
Got questions? Join the online conversation and get instant answers!
Jobilize.com Reply
Practice Key Terms 3

Get Jobilize Job Search Mobile App in your pocket Now!

Get it on Google Play Download on the App Store Now


Source:  OpenStax, College physics for ap® courses. OpenStax CNX. Nov 04, 2016 Download for free at https://legacy.cnx.org/content/col11844/1.14
Google Play and the Google Play logo are trademarks of Google Inc.

Notification Switch

Would you like to follow the 'College physics for ap® courses' conversation and receive update notifications?

Ask