<< Chapter < Page Chapter >> Page >

Making connections: historical note—kinetic theory of gases

The kinetic theory of gases was developed by Daniel Bernoulli (1700–1782), who is best known in physics for his work on fluid flow (hydrodynamics). Bernoulli’s work predates the atomistic view of matter established by Dalton.

Distribution of molecular speeds

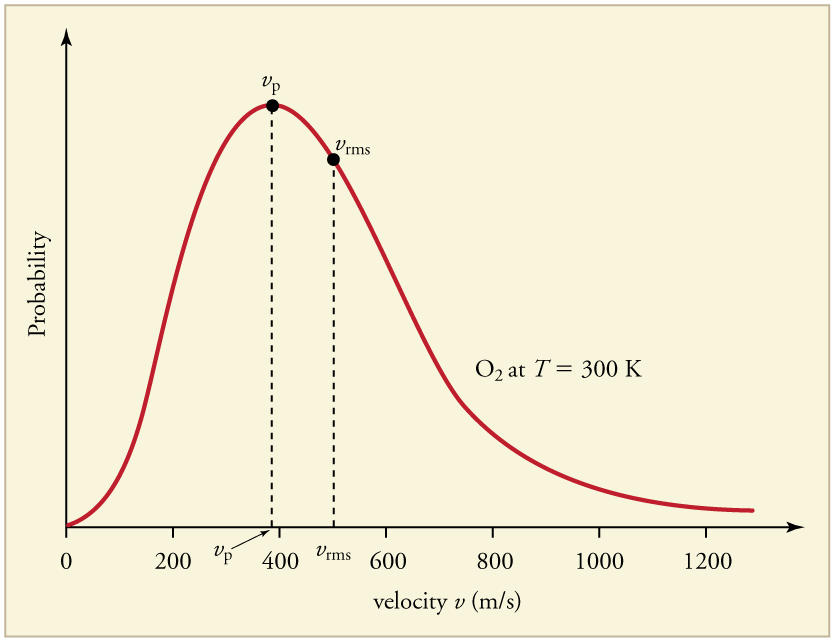
The motion of molecules in a gas is random in magnitude and direction for individual molecules, but a gas of many molecules has a predictable distribution of molecular speeds. This distribution is called the Maxwell-Boltzmann distribution , after its originators, who calculated it based on kinetic theory, and has since been confirmed experimentally. (See [link] .) The distribution has a long tail, because a few molecules may go several times the rms speed. The most probable speed v p size 12{v rSub { size 8{p} } } {} is less than the rms speed v rms size 12{v rSub { size 8{"rms"} } } {} . [link] shows that the curve is shifted to higher speeds at higher temperatures, with a broader range of speeds.

A line graph of probability versus velocity in meters per second of oxygen gas at 300 kelvin. The graph is skewed to the right, with a peak probability just under 400 meters per second and a root-mean-square probability of about 500 meters per second.
The Maxwell-Boltzmann distribution of molecular speeds in an ideal gas. The most likely speed v p size 12{v rSub { size 8{p} } } {} is less than the rms speed v rms size 12{v rSub { size 8{"rms"} } } {} . Although very high speeds are possible, only a tiny fraction of the molecules have speeds that are an order of magnitude greater than v rms size 12{v rSub { size 8{"rms"} } } {} .

The distribution of thermal speeds depends strongly on temperature. As temperature increases, the speeds are shifted to higher values and the distribution is broadened.

Two distributions of probability versus velocity at two different temperatures plotted on the same graph. Temperature two is greater than Temperature one. The distribution for Temperature two has a peak with a lower probability, but a higher velocity than the distribution for Temperature one. The T sub two graph has a more normal distribution and is broader while the T sub one graph is more narrow and has a tail extending to the right.
The Maxwell-Boltzmann distribution is shifted to higher speeds and is broadened at higher temperatures.

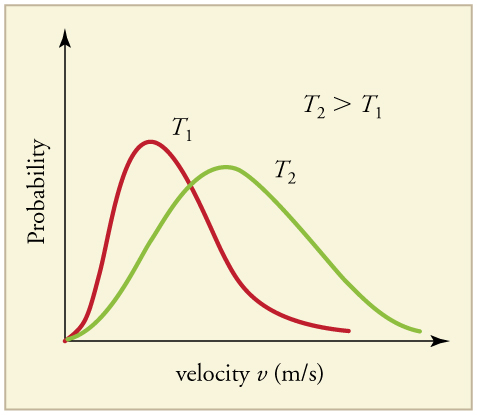
What is the implication of the change in distribution with temperature shown in [link] for humans? All other things being equal, if a person has a fever, he or she is likely to lose more water molecules, particularly from linings along moist cavities such as the lungs and mouth, creating a dry sensation in the mouth.

Calculating temperature: escape velocity of helium atoms

In order to escape Earth’s gravity, an object near the top of the atmosphere (at an altitude of 100 km) must travel away from Earth at 11.1 km/s. This speed is called the escape velocity . At what temperature would helium atoms have an rms speed equal to the escape velocity?

Strategy

Identify the knowns and unknowns and determine which equations to use to solve the problem.

Solution

1. Identify the knowns: v size 12{v} {} is the escape velocity, 11.1 km/s.

2. Identify the unknowns: We need to solve for temperature, T size 12{T} {} . We also need to solve for the mass m size 12{m} {} of the helium atom.

3. Determine which equations are needed.

  • To solve for mass m size 12{m} {} of the helium atom, we can use information from the periodic table:
    m = molar mass number of atoms per mole . size 12{m= { { size 11{"molar mass"}} over { size 11{"number of atoms per mole"}} } } {}
  • To solve for temperature T size 12{T} {} , we can rearrange either
    KE ¯ = 1 2 m v 2 ¯ = 3 2 kT size 12{ {overline {"KE"}} = { {1} over {2} } m {overline {v rSup { size 8{2} } }} = { {3} over {2} } ital "kT"} {}

    or

    v 2 ¯ = v rms = 3 kT m size 12{ sqrt { {overline {v rSup { size 8{2} } }} } =v rSub { size 8{"rms"} } = sqrt { { {3 ital "kT"} over {m} } } } {}

    to yield

    T = m v 2 ¯ 3 k , size 12{T= { {m {overline {v rSup { size 8{2} } }} } over {3k} } ,} {}
    where k size 12{k} {} is the Boltzmann constant and m size 12{m} {} is the mass of a helium atom.

4. Plug the known values into the equations and solve for the unknowns.

m = molar mass number of atoms per mole = 4 . 0026 × 10 3 kg/mol 6 . 02 × 10 23 mol = 6 . 65 × 10 27 kg size 12{m= { { size 11{"molar mass"}} over { size 11{"number of atoms per mole"}} } = { { size 11{4 "." "0026" times "10" rSup { size 8{ - 3} } " kg/mol"}} over { size 12{6 "." "02" times "10" rSup { size 8{"23"} } " mol"} } } =6 "." "65" times "10" rSup { size 8{ - "27"} } " kg"} {}
T = 6 . 65 × 10 27 kg 11 . 1 × 10 3 m/s 2 3 1 . 38 × 10 23 J/K = 1 . 98 × 10 4 K size 12{T= { { left (6 "." "65" times "10" rSup { size 8{ - "27"} } `"kg" right ) left ("11" "." 1 times "10" rSup { size 8{3} } `"m/s" right ) rSup { size 8{2} } } over {3 left (1 "." "38" times "10" rSup { size 8{ - "23"} } `"J/K" right )} } =1 "." "98" times "10" rSup { size 8{4} } `K} {}

Discussion

This temperature is much higher than atmospheric temperature, which is approximately 250 K ( 25 º C size 12{ \( –"25"°C} {} or 10 º F ) size 12{–"10"°F \) } {} at high altitude. Very few helium atoms are left in the atmosphere, but there were many when the atmosphere was formed. The reason for the loss of helium atoms is that there are a small number of helium atoms with speeds higher than Earth’s escape velocity even at normal temperatures. The speed of a helium atom changes from one instant to the next, so that at any instant, there is a small, but nonzero chance that the speed is greater than the escape speed and the molecule escapes from Earth’s gravitational pull. Heavier molecules, such as oxygen, nitrogen, and water (very little of which reach a very high altitude), have smaller rms speeds, and so it is much less likely that any of them will have speeds greater than the escape velocity. In fact, so few have speeds above the escape velocity that billions of years are required to lose significant amounts of the atmosphere. [link] shows the impact of a lack of an atmosphere on the Moon. Because the gravitational pull of the Moon is much weaker, it has lost almost its entire atmosphere. The comparison between Earth and the Moon is discussed in this chapter’s Problems and Exercises.

Questions & Answers

how do you get the 2/50
Abba Reply
number of sport play by 50 student construct discrete data
Aminu Reply
width of the frangebany leaves on how to write a introduction
Theresa Reply
Solve the mean of variance
Veronica Reply
Step 1: Find the mean. To find the mean, add up all the scores, then divide them by the number of scores. ... Step 2: Find each score's deviation from the mean. ... Step 3: Square each deviation from the mean. ... Step 4: Find the sum of squares. ... Step 5: Divide the sum of squares by n – 1 or N.
kenneth
what is error
Yakuba Reply
Is mistake done to something
Vutshila
Hy
anas
hy
What is the life teble
anas
hy
Jibrin
statistics is the analyzing of data
Tajudeen Reply
what is statics?
Zelalem Reply
how do you calculate mean
Gloria Reply
diveving the sum if all values
Shaynaynay
let A1,A2 and A3 events be independent,show that (A1)^c, (A2)^c and (A3)^c are independent?
Fisaye Reply
what is statistics
Akhisani Reply
data collected all over the world
Shaynaynay
construct a less than and more than table
Imad Reply
The sample of 16 students is taken. The average age in the sample was 22 years with astandard deviation of 6 years. Construct a 95% confidence interval for the age of the population.
Aschalew Reply
Bhartdarshan' is an internet-based travel agency wherein customer can see videos of the cities they plant to visit. The number of hits daily is a normally distributed random variable with a mean of 10,000 and a standard deviation of 2,400 a. what is the probability of getting more than 12,000 hits? b. what is the probability of getting fewer than 9,000 hits?
Akshay Reply
Bhartdarshan'is an internet-based travel agency wherein customer can see videos of the cities they plan to visit. The number of hits daily is a normally distributed random variable with a mean of 10,000 and a standard deviation of 2,400. a. What is the probability of getting more than 12,000 hits
Akshay
1
Bright
Sorry i want to learn more about this question
Bright
Someone help
Bright
a= 0.20233 b=0.3384
Sufiyan
a
Shaynaynay
How do I interpret level of significance?
Mohd Reply
It depends on your business problem or in Machine Learning you could use ROC- AUC cruve to decide the threshold value
Shivam
how skewness and kurtosis are used in statistics
Owen Reply
yes what is it
Taneeya
Got questions? Join the online conversation and get instant answers!
Jobilize.com Reply
Practice Key Terms 1

Get Jobilize Job Search Mobile App in your pocket Now!

Get it on Google Play Download on the App Store Now


Source:  OpenStax, College physics for ap® courses. OpenStax CNX. Nov 04, 2016 Download for free at https://legacy.cnx.org/content/col11844/1.14
Google Play and the Google Play logo are trademarks of Google Inc.

Notification Switch

Would you like to follow the 'College physics for ap® courses' conversation and receive update notifications?

Ask