By applying Kirchhoff’s rules, we generate equations that allow us to find the unknowns in circuits. The unknowns may be currents, emfs, or resistances. Each time a rule is applied, an equation is produced. If there are as many independent equations as unknowns, then the problem can be solved. There are two decisions you must make when applying Kirchhoff’s rules. These decisions determine the signs of various quantities in the equations you obtain from applying the rules.
When applying Kirchhoff’s first rule, the junction rule, you must label the current in each branch and decide in what direction it is going. For example, in
[link] ,
[link] , and
[link] , currents are labeled
,
,
, and
, and arrows indicate their directions. There is no risk here, for if you choose the wrong direction, the current will be of the correct magnitude but negative.
When applying Kirchhoff’s second rule, the loop rule, you must identify a closed loop and decide in which direction to go around it, clockwise or counterclockwise. For example, in
[link] the loop was traversed in the same direction as the current (clockwise). Again, there is no risk; going around the circuit in the opposite direction reverses the sign of every term in the equation, which is like multiplying both sides of the equation by
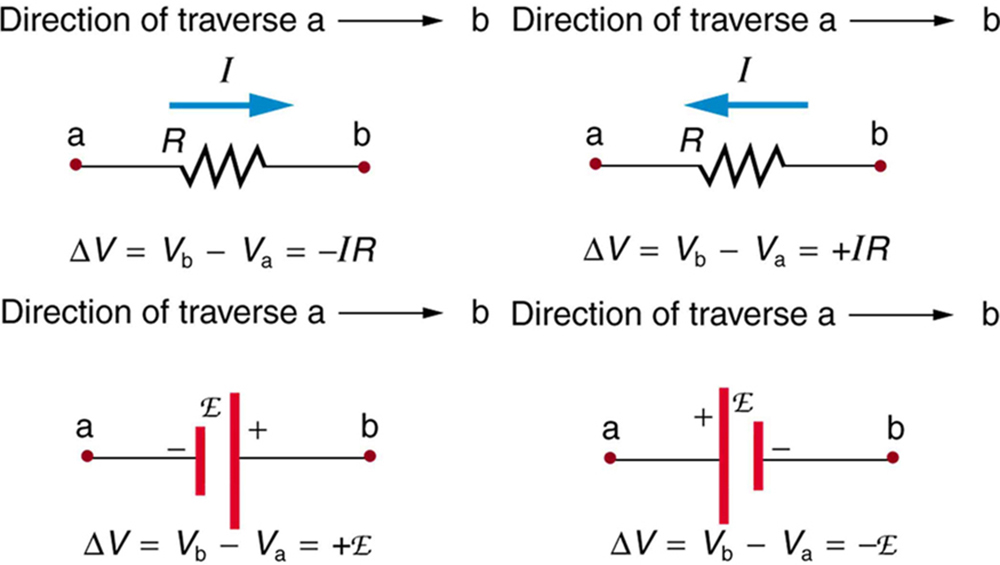
[link] and the following points will help you get the plus or minus signs right when applying the loop rule. Note that the resistors and emfs are traversed by going from a to b. In many circuits, it will be necessary to construct more than one loop. In traversing each loop, one needs to be consistent for the sign of the change in potential. (See
[link] .)
Each of these resistors and voltage sources is traversed from a to b. The potential changes are shown beneath each element and are explained in the text. (Note that the script E stands for emf.)
When a resistor is traversed in the same direction as the current, the change in potential is
. (See
[link] .)
When a resistor is traversed in the direction opposite to the current, the change in potential is
. (See
[link] .)
When an emf is traversed from
to + (the same direction it moves positive charge), the change in potential is +emf. (See
[link] .)
When an emf is traversed from + to
(opposite to the direction it moves positive charge), the change in potential is
emf. (See
[link] .)
Calculating current: using kirchhoff’s rules
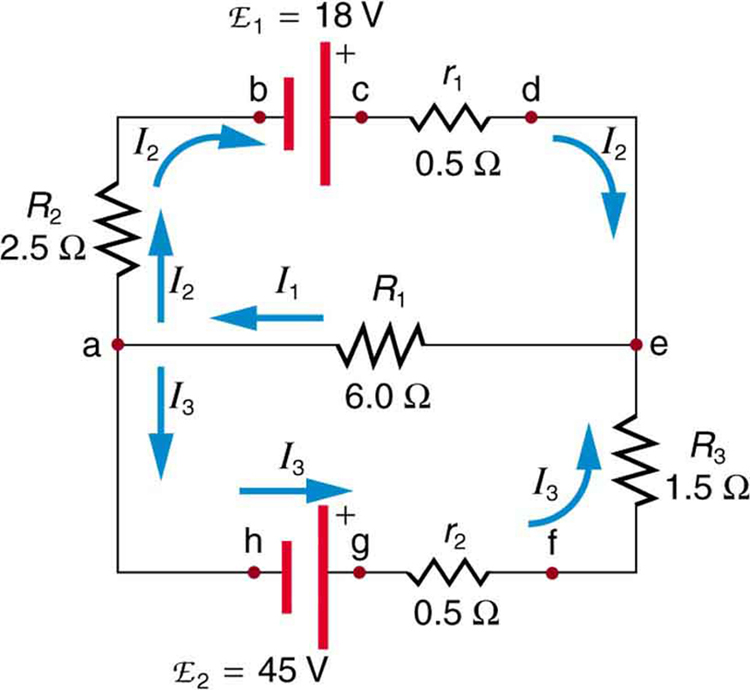
Find the currents flowing in the circuit in
[link] .
This circuit is similar to that in
[link] , but the resistances and emfs are specified. (Each emf is denoted by script E.) The currents in each branch are labeled and assumed to move in the directions shown. This example uses Kirchhoff’s rules to find the currents.
Strategy
This circuit is sufficiently complex that the currents cannot be found using Ohm’s law and the series-parallel techniques—it is necessary to use Kirchhoff’s rules. Currents have been labeled
,
, and
in the figure and assumptions have been made about their directions. Locations on the diagram have been labeled with letters a through h. In the solution we will apply the junction and loop rules, seeking three independent equations to allow us to solve for the three unknown currents.
Questions & Answers
differentiate between demand and supply
giving examples
In economics, a perfect market refers to a theoretical construct where all participants have perfect information, goods are homogenous, there are no barriers to entry or exit, and prices are determined solely by supply and demand. It's an idealized model used for analysis,
When MP₁ becomes negative, TP start to decline.
Extuples Suppose that the short-run production function of certain cut-flower firm is given by: Q=4KL-0.6K2 - 0.112 •
Where is quantity of cut flower produced, I is labour input and K is fixed capital input (K-5). Determine the average product of lab
Kelo
Extuples Suppose that the short-run production function of certain cut-flower firm is given by: Q=4KL-0.6K2 - 0.112 •
Where is quantity of cut flower produced, I is labour input and K is fixed capital input (K-5). Determine the average product of labour (APL) and marginal product of labour (MPL)
Quantity demanded refers to the specific amount of a good or service that consumers are willing and able to purchase at a give price and within a specific time period. Demand, on the other hand, is a broader concept that encompasses the entire relationship between price and quantity demanded
Ezea
ok
Shukri
how do you save a country economic situation when it's falling apart
Economic growth as an increase in the production and consumption of goods and services within an economy.but
Economic development as a broader concept that encompasses not only economic growth but also social & human well being.
Shukri
production function means
Jabir
What do you think is more important to focus on when considering inequality ?
sir...I just want to ask one question... Define the term contract curve? if you are free please help me to find this answer 🙏
Asui
it is a curve that we get after connecting the pareto optimal combinations of two consumers after their mutually beneficial trade offs
Awais
thank you so much 👍 sir
Asui
In economics, the contract curve refers to the set of points in an Edgeworth box diagram where both parties involved in a trade cannot be made better off without making one of them worse off. It represents the Pareto efficient allocations of goods between two individuals or entities, where neither p
Cornelius
In economics, the contract curve refers to the set of points in an Edgeworth box diagram where both parties involved in a trade cannot be made better off without making one of them worse off. It represents the Pareto efficient allocations of goods between two individuals or entities,
Cornelius
Suppose a consumer consuming two commodities X and Y has
The following utility function u=X0.4 Y0.6. If the price of the X and Y are 2 and 3 respectively and income Constraint is birr 50.
A,Calculate quantities of x and y which maximize utility.
B,Calculate value of Lagrange multiplier.
C,Calculate quantities of X and Y consumed with a given price.
D,alculate optimum level of output .
the market for lemon has 10 potential consumers, each having an individual demand curve p=101-10Qi, where p is price in dollar's per cup and Qi is the number of cups demanded per week by the i th consumer.Find the market demand curve using algebra. Draw an individual demand curve and the market dema
suppose the production function is given by ( L, K)=L¼K¾.assuming capital is fixed find APL and MPL. consider the following short run production function:Q=6L²-0.4L³ a) find the value of L that maximizes output b)find the value of L that maximizes marginal product