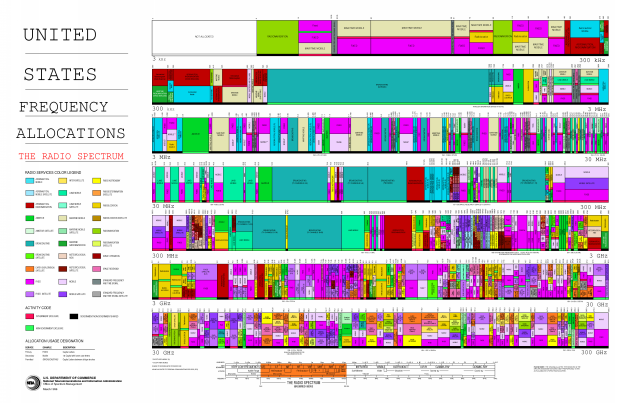
An explanation and picture of the frequency allocation chart.
To prevent radio stations from transmitting signals “on top of
each other,” the United States and other national governmentsin the 1930s began regulating the carrier frequencies and power
outputs stations could use. With increased use of the radiospectrum for both public and private use, this regulation has
become increasingly important. This is the so-called
Frequency Allocation Chart , which shows what kinds
of broadcasting can occur in which frequency bands. Detailedradio carrier frequency assignments are much too detailed to
present here.
the study of living organisms and their interactions with one another and their environment.
Wine
discuss the biological phenomenon and provide pieces of evidence to show that it was responsible for the formation of eukaryotic organelles in an essay form