<< Chapter < Page Chapter >> Page >

By the end of this section, you will be able to:

  • Explain recessions, depressions, peaks, and troughs
  • Evaluate the importance of tracking real GDP over time
  • Analyze the impact of economic fluctuations on a country’s output and price level

When news reports indicate that “the economy grew 1.2% in the first quarter,” the reports are referring to the percentage change in real GDP. By convention, GDP growth is reported at an annualized rate: Whatever the calculated growth in real GDP was for the quarter, it is multiplied by four when it is reported as if the economy were growing at that rate for a full year.
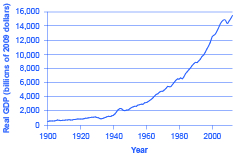
U.s. gdp, 1900–2014

The graph illustrates that both real GDP and real GDP per capita have substantially increased since 1900.
Real GDP in the United States in 2014 was about $16 trillion. After adjusting to remove the effects of inflation, this represents a roughly 20-fold increase in the economy’s production of goods and services since the start of the twentieth century. (Source: bea.gov)

[link] shows the pattern of U.S. real GDP since 1900. The generally upward long-term path of GDP has been regularly interrupted by short-term declines. A significant decline in real GDP is called a recession    . An especially lengthy and deep recession is called a depression    . The severe drop in GDP that occurred during the Great Depression of the 1930s is clearly visible in the figure, as is the Great Recession of 2008–2009.

Real GDP is important because it is highly correlated with other measures of economic activity, like employment and unemployment. When real GDP rises, so does employment.

The most significant human problem associated with recessions (and their larger, uglier cousins, depressions) is that a slowdown in production means that firms need to lay off or fire some of the workers they have. Losing a job imposes painful financial and personal costs on workers, and often on their extended families as well. In addition, even those who keep their jobs are likely to find that wage raises are scanty at best—or they may even be asked to take pay cuts.

[link] lists the pattern of recessions and expansions in the U.S. economy since 1900. The highest point of the economy, before the recession begins, is called the peak    ; conversely, the lowest point of a recession, before a recovery begins, is called the trough    . Thus, a recession lasts from peak to trough, and an economic upswing runs from trough to peak. The movement of the economy from peak to trough and trough to peak is called the business cycle    . It is intriguing to notice that the three longest trough-to-peak expansions of the twentieth century have happened since 1960. The most recent recession started in December 2007 and ended formally in June 2009. This was the most severe recession since the Great Depression of the 1930’s.

(Source: http://www.nber.org/cycles/main.html)
U.s. business cycles since 1900
Trough Peak Months of Contraction Months of Expansion
December 1900 September 1902 18 21
August 1904 May 1907 23 33
June 1908 January 1910 13 19
January 1912 January 1913 24 12
December 1914 August 1918 23 44
March 1919 January 1920 7 10
July 1921 May 1923 18 22
July 1924 October 1926 14 27
November 1927 August 1929 23 21
March 1933 May 1937 43 50
June 1938 February 1945 13 80
October 1945 November 1948 8 37
October 1949 July 1953 11 45
May 1954 August 1957 10 39
April 1958 April 1960 8 24
February 1961 December 1969 10 106
November 1970 November 1973 11 36
March 1975 January 1980 16 58
July 1980 July 1981 6 12
November 1982 July 1990 16 92
March 2001 November 2001 8 120
December 2007 June 2009 18 73

A private think tank, the National Bureau of Economic Research (NBER) , is the official tracker of business cycles for the U.S. economy. However, the effects of a severe recession often linger on after the official ending date assigned by the NBER.

Key concepts and summary

Over the long term, U.S. real GDP have increased dramatically. At the same time, GDP has not increased the same amount each year. The speeding up and slowing down of GDP growth represents the business cycle. When GDP declines significantly, a recession occurs. A longer and deeper decline is a depression. Recessions begin at the peak of the business cycle and end at the trough.

References

The National Bureau of Economic Research. “Information on Recessions and Recoveries, the NBER Business Cycle Dating Committee, and related topics.” http://www.nber.org/cycles/main.html.

Questions & Answers

differentiate between demand and supply giving examples
Lambiv Reply
differentiated between demand and supply using examples
Lambiv
what is labour ?
Lambiv
how will I do?
Venny Reply
how is the graph works?I don't fully understand
Rezat Reply
information
Eliyee
devaluation
Eliyee
t
WARKISA
hi guys good evening to all
Lambiv
multiple choice question
Aster Reply
appreciation
Eliyee
explain perfect market
Lindiwe Reply
In economics, a perfect market refers to a theoretical construct where all participants have perfect information, goods are homogenous, there are no barriers to entry or exit, and prices are determined solely by supply and demand. It's an idealized model used for analysis,
Ezea
What is ceteris paribus?
Shukri Reply
other things being equal
AI-Robot
When MP₁ becomes negative, TP start to decline. Extuples Suppose that the short-run production function of certain cut-flower firm is given by: Q=4KL-0.6K2 - 0.112 • Where is quantity of cut flower produced, I is labour input and K is fixed capital input (K-5). Determine the average product of lab
Kelo
Extuples Suppose that the short-run production function of certain cut-flower firm is given by: Q=4KL-0.6K2 - 0.112 • Where is quantity of cut flower produced, I is labour input and K is fixed capital input (K-5). Determine the average product of labour (APL) and marginal product of labour (MPL)
Kelo
yes,thank you
Shukri
Can I ask you other question?
Shukri
what is monopoly mean?
Habtamu Reply
What is different between quantity demand and demand?
Shukri Reply
Quantity demanded refers to the specific amount of a good or service that consumers are willing and able to purchase at a give price and within a specific time period. Demand, on the other hand, is a broader concept that encompasses the entire relationship between price and quantity demanded
Ezea
ok
Shukri
how do you save a country economic situation when it's falling apart
Lilia Reply
what is the difference between economic growth and development
Fiker Reply
Economic growth as an increase in the production and consumption of goods and services within an economy.but Economic development as a broader concept that encompasses not only economic growth but also social & human well being.
Shukri
production function means
Jabir
What do you think is more important to focus on when considering inequality ?
Abdisa Reply
any question about economics?
Awais Reply
sir...I just want to ask one question... Define the term contract curve? if you are free please help me to find this answer 🙏
Asui
it is a curve that we get after connecting the pareto optimal combinations of two consumers after their mutually beneficial trade offs
Awais
thank you so much 👍 sir
Asui
In economics, the contract curve refers to the set of points in an Edgeworth box diagram where both parties involved in a trade cannot be made better off without making one of them worse off. It represents the Pareto efficient allocations of goods between two individuals or entities, where neither p
Cornelius
In economics, the contract curve refers to the set of points in an Edgeworth box diagram where both parties involved in a trade cannot be made better off without making one of them worse off. It represents the Pareto efficient allocations of goods between two individuals or entities,
Cornelius
Suppose a consumer consuming two commodities X and Y has The following utility function u=X0.4 Y0.6. If the price of the X and Y are 2 and 3 respectively and income Constraint is birr 50. A,Calculate quantities of x and y which maximize utility. B,Calculate value of Lagrange multiplier. C,Calculate quantities of X and Y consumed with a given price. D,alculate optimum level of output .
Feyisa Reply
Answer
Feyisa
c
Jabir
the market for lemon has 10 potential consumers, each having an individual demand curve p=101-10Qi, where p is price in dollar's per cup and Qi is the number of cups demanded per week by the i th consumer.Find the market demand curve using algebra. Draw an individual demand curve and the market dema
Gsbwnw Reply
suppose the production function is given by ( L, K)=L¼K¾.assuming capital is fixed find APL and MPL. consider the following short run production function:Q=6L²-0.4L³ a) find the value of L that maximizes output b)find the value of L that maximizes marginal product
Abdureman
types of unemployment
Yomi Reply
What is the difference between perfect competition and monopolistic competition?
Mohammed
Got questions? Join the online conversation and get instant answers!
Jobilize.com Reply

Get Jobilize Job Search Mobile App in your pocket Now!

Get it on Google Play Download on the App Store Now


Source:  OpenStax, University of houston downtown: macroeconomics. OpenStax CNX. May 28, 2014 Download for free at http://legacy.cnx.org/content/col11653/1.3
Google Play and the Google Play logo are trademarks of Google Inc.

Notification Switch

Would you like to follow the 'University of houston downtown: macroeconomics' conversation and receive update notifications?

Ask