<< Chapter < Page Chapter >> Page >

By the end of this section, you will be able to:

  • Identify the components of GDP on the demand side and on the supply side
  • Evaluate how gross domestic product (GDP) is measured
  • Contrast and calculate GDP, net exports, and net national product

Macroeconomics is an empirical subject, so the first step toward understanding it is to measure the economy.

How large is the U.S. economy? The size of a nation’s overall economy is typically measured by its gross domestic product (GDP)    , which is the value of all final goods and services produced within a country in a given year. The measurement of GDP involves counting up the production of millions of different goods and services—smart phones, cars, music downloads, computers, steel, bananas, college educations, and all other new goods and services produced in the current year—and summing them into a total dollar value. This task is straightforward: take the quantity of everything produced, multiply it by the price at which each product sold, and add up the total. In 2014, the U.S. GDP totaled $17.4 trillion, the largest GDP in the world.

Each of the market transactions that enter into GDP must involve both a buyer and a seller. The GDP of an economy can be measured either by the total dollar value of what is purchased in the economy, or by the total dollar value of what is produced. There is even a third way, as we will explain later.

Gdp measured by components of demand

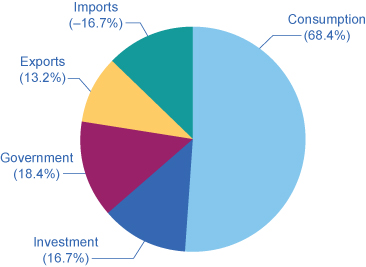
Who buys all of this production? This demand    can be divided into four main parts: consumer spending (consumption), business spending (investment), government spending on goods and services, and spending on net exports. (See the following Clear It Up feature to understand what is meant by investment.) [link] shows how these four components added up to the GDP in 2014. [link] (a) shows the levels of consumption, investment, and government purchases over time, expressed as a percentage of GDP, while [link] (b) shows the levels of exports and imports as a percentage of GDP over time. A few patterns about each of these components are worth noticing. [link] shows the components of GDP from the demand side. [link] provides a visual of the percentages.

(Source: http://bea.gov/iTable/index_nipa.cfm)
Components of u.s. gdp in 2014: from the demand side
Components of GDP on the Demand Side (in trillions of dollars) Percentage of Total
Consumption $11.9 68.4%
Investment $2.9 16.7%
Government $3.2 18.4%
Exports $2.3 13.2%
Imports –$2.9 –16.7%
Total GDP $17.4 100%

Percentage of components of u.s. gdp on the demand side

This pie chart shows the percentage of components of U.S. GDP on the demand side as follows: Consumption: 68.4% Investment: 16.7% Government: 18.4% Exports: 13.2% Imports: −16.7%
Consumption makes up over half of the demand side components of the GDP. (Source: http://bea.gov/iTable/index_nipa.cfm)

What is meant by the word “investment”?

What do economists mean by investment, or business spending? In calculating GDP, investment does not refer to the purchase of stocks and bonds or the trading of financial assets. It refers to the purchase of new capital goods, that is, new commercial real estate (such as buildings, factories, and stores) and equipment, residential housing construction, and inventories. Inventories that are produced this year are included in this year’s GDP—even if they have not yet sold. From the accountant’s perspective, it is as if the firm invested in its own inventories. Business investment in 2014 was almost $3 trillion, according to the Bureau of Economic Analysis.

Questions & Answers

differentiate between demand and supply giving examples
Lambiv Reply
differentiated between demand and supply using examples
Lambiv
what is labour ?
Lambiv
how will I do?
Venny Reply
how is the graph works?I don't fully understand
Rezat Reply
information
Eliyee
devaluation
Eliyee
t
WARKISA
hi guys good evening to all
Lambiv
multiple choice question
Aster Reply
appreciation
Eliyee
explain perfect market
Lindiwe Reply
In economics, a perfect market refers to a theoretical construct where all participants have perfect information, goods are homogenous, there are no barriers to entry or exit, and prices are determined solely by supply and demand. It's an idealized model used for analysis,
Ezea
What is ceteris paribus?
Shukri Reply
other things being equal
AI-Robot
When MP₁ becomes negative, TP start to decline. Extuples Suppose that the short-run production function of certain cut-flower firm is given by: Q=4KL-0.6K2 - 0.112 • Where is quantity of cut flower produced, I is labour input and K is fixed capital input (K-5). Determine the average product of lab
Kelo
Extuples Suppose that the short-run production function of certain cut-flower firm is given by: Q=4KL-0.6K2 - 0.112 • Where is quantity of cut flower produced, I is labour input and K is fixed capital input (K-5). Determine the average product of labour (APL) and marginal product of labour (MPL)
Kelo
yes,thank you
Shukri
Can I ask you other question?
Shukri
what is monopoly mean?
Habtamu Reply
What is different between quantity demand and demand?
Shukri Reply
Quantity demanded refers to the specific amount of a good or service that consumers are willing and able to purchase at a give price and within a specific time period. Demand, on the other hand, is a broader concept that encompasses the entire relationship between price and quantity demanded
Ezea
ok
Shukri
how do you save a country economic situation when it's falling apart
Lilia Reply
what is the difference between economic growth and development
Fiker Reply
Economic growth as an increase in the production and consumption of goods and services within an economy.but Economic development as a broader concept that encompasses not only economic growth but also social & human well being.
Shukri
production function means
Jabir
What do you think is more important to focus on when considering inequality ?
Abdisa Reply
any question about economics?
Awais Reply
sir...I just want to ask one question... Define the term contract curve? if you are free please help me to find this answer 🙏
Asui
it is a curve that we get after connecting the pareto optimal combinations of two consumers after their mutually beneficial trade offs
Awais
thank you so much 👍 sir
Asui
In economics, the contract curve refers to the set of points in an Edgeworth box diagram where both parties involved in a trade cannot be made better off without making one of them worse off. It represents the Pareto efficient allocations of goods between two individuals or entities, where neither p
Cornelius
In economics, the contract curve refers to the set of points in an Edgeworth box diagram where both parties involved in a trade cannot be made better off without making one of them worse off. It represents the Pareto efficient allocations of goods between two individuals or entities,
Cornelius
Suppose a consumer consuming two commodities X and Y has The following utility function u=X0.4 Y0.6. If the price of the X and Y are 2 and 3 respectively and income Constraint is birr 50. A,Calculate quantities of x and y which maximize utility. B,Calculate value of Lagrange multiplier. C,Calculate quantities of X and Y consumed with a given price. D,alculate optimum level of output .
Feyisa Reply
Answer
Feyisa
c
Jabir
the market for lemon has 10 potential consumers, each having an individual demand curve p=101-10Qi, where p is price in dollar's per cup and Qi is the number of cups demanded per week by the i th consumer.Find the market demand curve using algebra. Draw an individual demand curve and the market dema
Gsbwnw Reply
suppose the production function is given by ( L, K)=L¼K¾.assuming capital is fixed find APL and MPL. consider the following short run production function:Q=6L²-0.4L³ a) find the value of L that maximizes output b)find the value of L that maximizes marginal product
Abdureman
types of unemployment
Yomi Reply
What is the difference between perfect competition and monopolistic competition?
Mohammed
Got questions? Join the online conversation and get instant answers!
Jobilize.com Reply

Get Jobilize Job Search Mobile App in your pocket Now!

Get it on Google Play Download on the App Store Now


Source:  OpenStax, University of houston downtown: macroeconomics. OpenStax CNX. May 28, 2014 Download for free at http://legacy.cnx.org/content/col11653/1.3
Google Play and the Google Play logo are trademarks of Google Inc.

Notification Switch

Would you like to follow the 'University of houston downtown: macroeconomics' conversation and receive update notifications?

Ask