<< Chapter < Page Chapter >> Page >
This module demonstrates the effect that a time-invariant filter can have on periodic waveforms.

The Fourier series representation of a periodic signal makes it easy to determine how a linear, time-invariant filter reshapessuch signals in general . The fundamental property of a linear system is that its input-output relationobeys superposition: L a 1 s 1 t a 2 s 2 t a 1 L s 1 t a 2 L s 2 t . Because the Fourier series represents a periodic signal as alinear combination of complex exponentials, we can exploit the superposition property. Furthermore, we found for linearcircuits that their output to a complex exponential input is just the frequency response evaluated at the signal's frequencytimes the complex exponential. Said mathematically, if x t 2 k t T , then the output y t H k T 2 k t T because f k T . Thus, if x t is periodic thereby having a Fourier series, a linear circuit's output to this signal will be the superposition of the output toeach component.

y t k c k H k T 2 k t T
Thus, the output has a Fourier series, which means that it too is periodic. Its Fourier coefficients equal c k H k T . To obtain the spectrum of the output, we simply multiply the input spectrum by the frequency response . The circuit modifies the magnitude and phase of each Fouriercoefficient. Note especially that while the Fourier coefficients do not depend on the signal's period, the circuit'stransfer function does depend on frequency, which means that the circuit's output willdiffer as the period varies.

Filtering a periodic signal

Periodic pulse signal
Top plots show the pulse signal's spectrum for various cutoff frequencies. Bottom plots show the filter's outputsignals.
A periodic pulse signal, such as shown on the left part ( Δ T 0.2 ), serves as the input to an R C lowpass filter. The input's period was 1 ms (millisecond). The filter's cutoff frequency was set to the various valuesindicated in the top row, which display the output signal's spectrum and the filter's transfer function. The bottom rowshows the output signal derived from the Fourier series coefficients shown in the top row.

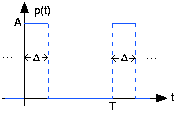
The periodic pulse signal shown on the left above serves as the input to a R C -circuit that has the transfer function (calculated elsewhere )

H f 1 1 2 f R C
[link] shows the output changes as we vary the filter's cutoff frequency. Note how thesignal's spectrum extends well above its fundamental frequency. Having a cutoff frequency ten times higher thanthe fundamental does perceptibly change the output waveform, rounding the leading and trailing edges. As the cutofffrequency decreases (center, then left), the rounding becomes more prominent, with the leftmost waveform showing a smallripple.

Got questions? Get instant answers now!

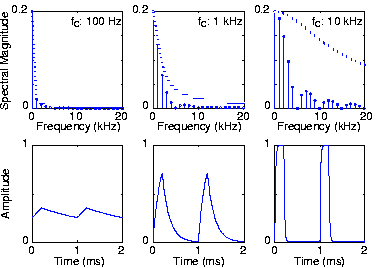
What is the average value of each output waveform? The correct answer may surprise you.

Because the filter's gain at zero frequency equals one, the average output values equal the respective average inputvalues.

Got questions? Get instant answers now!

This example also illustrates the impact a lowpass filter canhave on a waveform. The simple R C filter used here has a rather gradual frequency response, which means that higher harmonics are smoothly suppressed. Later, wewill describe filters that have much more rapidly varying frequency responses, allowing a much more dramatic selection ofthe input's Fourier coefficients.

More importantly, we have calculated the output of a circuit toa periodic input without writing, much less solving, the differential equation governing the circuit'sbehavior. Furthermore, we made these calculations entirely in the frequency domain. Using Fourier series, we can calculatehow any linear circuit will respond to a periodic input.

Questions & Answers

A golfer on a fairway is 70 m away from the green, which sits below the level of the fairway by 20 m. If the golfer hits the ball at an angle of 40° with an initial speed of 20 m/s, how close to the green does she come?
Aislinn Reply
cm
tijani
what is titration
John Reply
what is physics
Siyaka Reply
A mouse of mass 200 g falls 100 m down a vertical mine shaft and lands at the bottom with a speed of 8.0 m/s. During its fall, how much work is done on the mouse by air resistance
Jude Reply
Can you compute that for me. Ty
Jude
what is the dimension formula of energy?
David Reply
what is viscosity?
David
what is inorganic
emma Reply
what is chemistry
Youesf Reply
what is inorganic
emma
Chemistry is a branch of science that deals with the study of matter,it composition,it structure and the changes it undergoes
Adjei
please, I'm a physics student and I need help in physics
Adjanou
chemistry could also be understood like the sexual attraction/repulsion of the male and female elements. the reaction varies depending on the energy differences of each given gender. + masculine -female.
Pedro
A ball is thrown straight up.it passes a 2.0m high window 7.50 m off the ground on it path up and takes 1.30 s to go past the window.what was the ball initial velocity
Krampah Reply
2. A sled plus passenger with total mass 50 kg is pulled 20 m across the snow (0.20) at constant velocity by a force directed 25° above the horizontal. Calculate (a) the work of the applied force, (b) the work of friction, and (c) the total work.
Sahid Reply
you have been hired as an espert witness in a court case involving an automobile accident. the accident involved car A of mass 1500kg which crashed into stationary car B of mass 1100kg. the driver of car A applied his brakes 15 m before he skidded and crashed into car B. after the collision, car A s
Samuel Reply
can someone explain to me, an ignorant high school student, why the trend of the graph doesn't follow the fact that the higher frequency a sound wave is, the more power it is, hence, making me think the phons output would follow this general trend?
Joseph Reply
Nevermind i just realied that the graph is the phons output for a person with normal hearing and not just the phons output of the sound waves power, I should read the entire thing next time
Joseph
Follow up question, does anyone know where I can find a graph that accuretly depicts the actual relative "power" output of sound over its frequency instead of just humans hearing
Joseph
"Generation of electrical energy from sound energy | IEEE Conference Publication | IEEE Xplore" ***ieeexplore.ieee.org/document/7150687?reload=true
Ryan
what's motion
Maurice Reply
what are the types of wave
Maurice
answer
Magreth
progressive wave
Magreth
hello friend how are you
Muhammad Reply
fine, how about you?
Mohammed
hi
Mujahid
A string is 3.00 m long with a mass of 5.00 g. The string is held taut with a tension of 500.00 N applied to the string. A pulse is sent down the string. How long does it take the pulse to travel the 3.00 m of the string?
yasuo Reply
Who can show me the full solution in this problem?
Reofrir Reply
Got questions? Join the online conversation and get instant answers!
Jobilize.com Reply

Get Jobilize Job Search Mobile App in your pocket Now!

Get it on Google Play Download on the App Store Now


Source:  OpenStax, Fundamentals of electrical engineering i. OpenStax CNX. Aug 06, 2008 Download for free at http://legacy.cnx.org/content/col10040/1.9
Google Play and the Google Play logo are trademarks of Google Inc.

Notification Switch

Would you like to follow the 'Fundamentals of electrical engineering i' conversation and receive update notifications?

Ask