

| << Chapter < Page | Chapter >> Page > |
A signal's Fourier series spectrum has interesting properties.
PropertyIf is real, (real-valued periodic signals have conjugate-symmetric spectra).
This result follows from the integral that calculates the from the signal. Furthermore, this result means that : The real part of the Fourier coefficients for real-valuedsignals is even. Similarly, : The imaginary parts of the Fourier coefficients have oddsymmetry. Consequently, if you are given the Fourier coefficients for positive indices and zero and are told thesignal is real-valued, you can find the negative-indexed coefficients, hence the entire spectrum. This kind of symmetry, , is known as conjugate symmetry .
PropertyIf , which says the signal has even symmetry about the origin, .
Given the previous property for real-valued signals, the Fourier coefficients of even signals are real-valued. A real-valuedFourier expansion amounts to an expansion in terms of only cosines, which is the simplest example of an even signal.
PropertyIf , which says the signal has odd symmetry, .
Therefore, the Fourier coefficients are purely imaginary. The square wave is a great example of an odd-symmetric signal.
PropertyThe spectral coefficients for a periodic signal delayed by , , are , where denotes the spectrum of . Delaying a signal by seconds results in a spectrum having a linear phase shift of in comparison to the spectrum of the undelayed signal. Notethat the spectral magnitude is unaffected. Showing this property is easy.
The complex Fourier series obeys
Parseval's Theorem , one of the
most important results in signal analysis.This general mathematical result says
you can calculate a signal's power in either the time domain or the frequencydomain.
Average power calculated in the time domain equals the powercalculated in the frequency domain.
Parseval's theorem
This result is a (simpler) re-expression of how tocalculate a signal's power than with the real-valued
Fourier series expression for power.
Let's calculate the Fourier coefficients of the periodic
pulse signalshown
here .
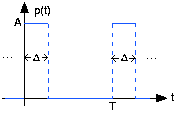
Also note the presence of a linear phase term (the first term in is proportional to frequency ). Comparing this term with that predicted from delaying a signal,a delay of is present in our signal. Advancing the signal by this amountcenters the pulse about the origin, leaving an even signal, which in turn means that its spectrum is real-valued. Thus, ourcalculated spectrum is consistent with the properties of the Fourier spectrum.
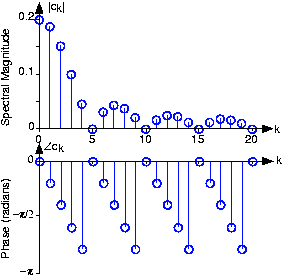
What is the value of ? Recalling that this spectral coefficient corresponds to thesignal's average value, does your answer make sense?
. This quantity clearly corresponds to the periodic pulsesignal's average value.
The phase plot shown in [link] requires some explanation as it does not seem to agree with what [link] suggests. There, the phase has a linear component, with a jump of every time the sinusoidal term changes sign. We must realize that any integer multiple of can be added to a phase at each frequency without affecting the value of the complex spectrum. We see that at frequency index 4 the phase is nearly . The phase at index 5 is undefined because the magnitude is zeroin this example. At index 6, the formula suggests that the phase of the linear term should be less than (more negative). In addition, we expect a shift of in the phase between indices 4 and 6. Thus, the phase value predicted by the formula is a little less than . Because we can add without affecting the value of the spectrum at index 6, theresult is a slightly negative number as shown. Thus, the formula and the plot do agree. In phase calculations like those made inMATLAB, values are usually confined to the range by adding some (possibly negative) multiple of to each phase value.
Notification Switch
Would you like to follow the 'Pdf generation test course' conversation and receive update notifications?

|
|

|
|

|
|

|
|

|
|

|
|

|
|

|
|
|
|
|

|