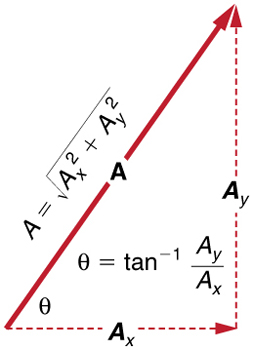
If the perpendicular components
and
of a vector
are known, then
can also be found analytically. To find the magnitude
and direction
of a vector from its perpendicular components
and
, we use the following relationships:
The magnitude and direction of the resultant vector can be determined once the horizontal and vertical components
and
have been determined.
Note that the equation
is just the Pythagorean theorem relating the legs of a right triangle to the length of the hypotenuse. For example, if
and
are 9 and 5 blocks, respectively, then
blocks, again consistent with the example of the person walking in a city. Finally, the direction is
, as before.
Determining vectors and vector components with analytical methods
Equations
and
are used to find the perpendicular components of a vector—that is, to go from
and
to
and
. Equations
and
are used to find a vector from its perpendicular components—that is, to go from
and
to
and
. Both processes are crucial to analytical methods of vector addition and subtraction.
Adding vectors using analytical methods
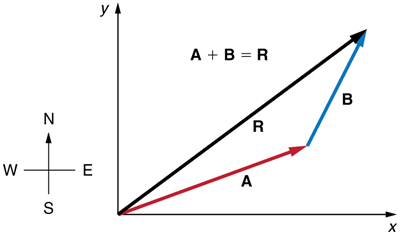
To see how to add vectors using perpendicular components, consider
[link] , in which the vectors
and
are added to produce the resultant
.
Vectors
and
are two legs of a walk, and
is the resultant or total displacement. You can use analytical methods to determine the magnitude and direction of
.
If
and
represent two legs of a walk (two displacements), then
is the total displacement. The person taking the walk ends up at the tip of
There are many ways to arrive at the same point. In particular, the person could have walked first in the
x -direction and then in the
y -direction. Those paths are the
x - and
y -components of the resultant,
and
. If we know
and
, we can find
and
using the equations
and
. When you use the analytical method of vector addition, you can determine the components or the magnitude and direction of a vector.
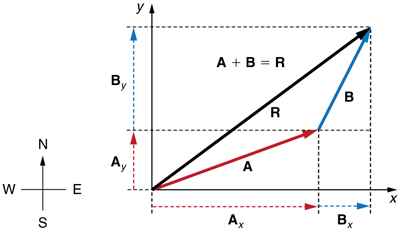
Step 1.Identify the x- and y-axes that will be used in the problem. Then, find the components of each vector to be added along the chosen perpendicular axes . Use the equations
and
to find the components. In
[link] , these components are
,
,
, and
. The angles that vectors
and
make with the
x -axis are
and
, respectively.
To add vectors
and
, first determine the horizontal and vertical components of each vector. These are the dotted vectors
,
,
and
shown in the image.
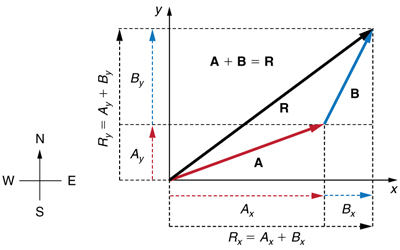
Step 2.Find the components of the resultant along each axis by adding the components of the individual vectors along that axis . That is, as shown in
[link] ,
and
The magnitude of the vectors
and
add to give the magnitude
of the resultant vector in the horizontal direction. Similarly, the magnitudes of the vectors
and
add to give the magnitude
of the resultant vector in the vertical direction.
Receive real-time job alerts and never miss the right job again
Source:
OpenStax, Sample chapters: openstax college physics for ap® courses. OpenStax CNX. Oct 23, 2015 Download for free at http://legacy.cnx.org/content/col11896/1.9
Google Play and the Google Play logo are trademarks of Google Inc.
Notification Switch
Would you like to follow the 'Sample chapters: openstax college physics for ap® courses' conversation and receive update notifications?