Descriptive Statistics: Homework is part of the collection col10555 written by Barbara Illowsky and Susan Dean and provides homework questions related to lessons about descriptive statistics.
Twenty-five randomly selected students were asked the number of movies they watched the previous week. The results are as follows:
# of movies
Frequency
Relative Frequency
Cumulative Relative Frequency
0
5
1
9
2
6
3
4
4
1
Find the sample mean
Find the sample standard deviation,
Construct a histogram of the data.
Complete the columns of the chart.
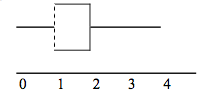
Find the first quartile.
Find the median.
Find the third quartile.
Construct a box plot of the data.
What percent of the students saw fewer than three movies?
Find the 40th percentile.
Find the 90th percentile.
Construct a line graph of the data.
Construct a stem plot of the data.
1.48
1.12
1
1
2
80%
1
3
The median age for U.S. blacks currently is 30.9 years; for U.S. whites it is 42.3 years. ((
Source: http://www.usatoday.com/news/nation/story/2012-05-17/minority-births-census/55029100/1) )
Based upon this information, give two reasons why the black median age could be lower than the white median age.
Does the lower median age for blacks necessarily mean that blacks die younger than whites? Why or why not?
How might it be possible for blacks and whites to die at approximately the same age, but for the median age for whites to be higher?
Forty randomly selected students were asked the number of pairs of sneakers they owned. Let X = the number of pairs of sneakers owned. The results are as follows:
X
Frequency
Relative Frequency
Cumulative Relative Frequency
1
2
2
5
3
8
4
12
5
12
7
1
Find the sample mean
Find the sample standard deviation,
Construct a histogram of the data.
Complete the columns of the chart.
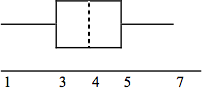
Find the first quartile.
Find the median.
Find the third quartile.
Construct a box plot of the data.
What percent of the students owned at least five pairs?
Find the 40th percentile.
Find the 90th percentile.
Construct a line graph of the data
Construct a stem plot of the data
3.78
1.29
3
4
5
32.5%
4
5
600 adult Americans were asked by telephone poll,
What do you think constitutes a middle-class income?The results are below. Also, include left endpoint, but not the right endpoint. (
Source: Time magazine; survey by Yankelovich Partners, Inc. )
"Not sure" answers were omitted from the results.
Salary ($)
Relative Frequency
<20,000
0.02
20,000 - 25,000
0.09
25,000 - 30,000
0.19
30,000 - 40,000
0.26
40,000 - 50,000
0.18
50,000 - 75,000
0.17
75,000 - 99,999
0.02
100,000+
0.01
What percent of the survey answered
"not sure"?
What percent think that middle-class is from $25,000 - $50,000 ?
Construct a histogram of the data
Should all bars have the same width, based on the data? Why or why not?
How should the<20,000
and the100,000+
intervals be handled? Why?
Find the 40th and 80th percentiles
Construct a bar graph of the data
Following are the published weights (in pounds) of all of the team members of the San Francisco 49ers from a previous year
(
Source: San Jose Mercury News )
177
205
210
210
232
205
185
185
178
210
206
212
184
174
185
242
188
212
215
247
241
223
220
260
245
259
278
270
280
295
275
285
290
272
273
280
285
286
200
215
185
230
250
241
190
260
250
302
265
290
276
228
265
Organize the data from smallest to largest value.
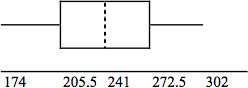
Find the median.
Find the first quartile.
Find the third quartile.
Construct a box plot of the data.
The middle 50% of the weights are from _______ to _______.
If our population were all professional football players, would the above data be a sample of weights or the population of weights? Why?
If our population were the San Francisco 49ers, would the above data be a sample of weights or the population of weights? Why?
Assume the population was the San Francisco 49ers. Find:
the population mean,
.
the population standard deviation,
.
the weight that is 2 standard deviations below the mean.
When Steve Young, quarterback, played football, he weighed 205 pounds. How many standard deviations above or below the mean was he?
That same year, the mean weight for the Dallas Cowboys was 240.08 pounds with a standard deviation of 44.38 pounds. Emmit Smith weighed in at 209 pounds. With respect to his team, who was lighter, Smith or Young? How did you determine your answer?
241
205.5
272.5
205.5, 272.5
sample
population
236.34
37.50
161.34
0.84 std. dev. below the mean
Young
Questions & Answers
What are the factors that affect demand for a commodity
In economics, a perfect market refers to a theoretical construct where all participants have perfect information, goods are homogenous, there are no barriers to entry or exit, and prices are determined solely by supply and demand. It's an idealized model used for analysis,
When MP₁ becomes negative, TP start to decline.
Extuples Suppose that the short-run production function of certain cut-flower firm is given by: Q=4KL-0.6K2 - 0.112 •
Where is quantity of cut flower produced, I is labour input and K is fixed capital input (K-5). Determine the average product of lab
Kelo
Extuples Suppose that the short-run production function of certain cut-flower firm is given by: Q=4KL-0.6K2 - 0.112 •
Where is quantity of cut flower produced, I is labour input and K is fixed capital input (K-5). Determine the average product of labour (APL) and marginal product of labour (MPL)
Quantity demanded refers to the specific amount of a good or service that consumers are willing and able to purchase at a give price and within a specific time period. Demand, on the other hand, is a broader concept that encompasses the entire relationship between price and quantity demanded
Ezea
ok
Shukri
how do you save a country economic situation when it's falling apart
Economic growth as an increase in the production and consumption of goods and services within an economy.but
Economic development as a broader concept that encompasses not only economic growth but also social & human well being.
Shukri
production function means
Jabir
What do you think is more important to focus on when considering inequality ?
sir...I just want to ask one question... Define the term contract curve? if you are free please help me to find this answer 🙏
Asui
it is a curve that we get after connecting the pareto optimal combinations of two consumers after their mutually beneficial trade offs
Awais
thank you so much 👍 sir
Asui
In economics, the contract curve refers to the set of points in an Edgeworth box diagram where both parties involved in a trade cannot be made better off without making one of them worse off. It represents the Pareto efficient allocations of goods between two individuals or entities, where neither p
Cornelius
In economics, the contract curve refers to the set of points in an Edgeworth box diagram where both parties involved in a trade cannot be made better off without making one of them worse off. It represents the Pareto efficient allocations of goods between two individuals or entities,
Cornelius
Suppose a consumer consuming two commodities X and Y has
The following utility function u=X0.4 Y0.6. If the price of the X and Y are 2 and 3 respectively and income Constraint is birr 50.
A,Calculate quantities of x and y which maximize utility.
B,Calculate value of Lagrange multiplier.
C,Calculate quantities of X and Y consumed with a given price.
D,alculate optimum level of output .
the market for lemon has 10 potential consumers, each having an individual demand curve p=101-10Qi, where p is price in dollar's per cup and Qi is the number of cups demanded per week by the i th consumer.Find the market demand curve using algebra. Draw an individual demand curve and the market dema
suppose the production function is given by ( L, K)=L¼K¾.assuming capital is fixed find APL and MPL. consider the following short run production function:Q=6L²-0.4L³ a) find the value of L that maximizes output b)find the value of L that maximizes marginal product
Abdureman
Got questions? Join the online conversation and get instant answers!