

| << Chapter < Page | Chapter >> Page > |
Four sororities took a random sample of sisters regarding their grade means for the past term. The results are shown in [link] .
| Sorority 1 | Sorority 2 | Sorority 3 | Sorority 4 |
|---|---|---|---|
| 2.17 | 2.63 | 2.63 | 3.79 |
| 1.85 | 1.77 | 3.78 | 3.45 |
| 2.83 | 3.25 | 4.00 | 3.08 |
| 1.69 | 1.86 | 2.55 | 2.26 |
| 3.33 | 2.21 | 2.45 | 3.18 |
Using a significance level of 1%, is there a difference in mean grades among the sororities?
Let μ 1 , μ 2 , μ 3 , μ 4 be the population means of the sororities. Remember that the null hypothesis claims that the sorority groups are from the same normal distribution. The alternate hypothesis says that at least two of the sorority groups come from populations with different normal distributions. Notice that the four sample sizes are each five.
This is an example of a balanced design , because each factor (i.e., sorority) has the same number of observations.
H 0 :
H a : Not all of the means are equal.
Distribution for the test: F 3,16
where k = 4 groups and n = 20 samples in total
df ( num )= k – 1 = 4 – 1 = 3
df ( denom ) = n – k = 20 – 4 = 16
Calculate the test statistic: F = 2.23
Graph:
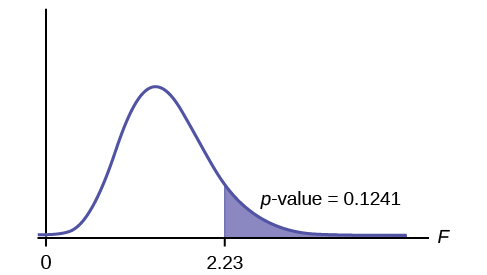
Probability statement: p -value = P ( F >2.23) = 0.1241
Compare
α and the
p -value:
α = 0.01
p -value = 0.1241
α <
p -value
Make a decision: Since α < p -value, you cannot reject H 0 .
Conclusion: There is not sufficient evidence to conclude that there is a difference among the mean grades for the sororities.
Four sports teams took a random sample of players regarding their GPAs for the last year. The results are shown in [link] .
| Basketball | Baseball | Hockey | Lacrosse |
|---|---|---|---|
| 3.6 | 2.1 | 4.0 | 2.0 |
| 2.9 | 2.6 | 2.0 | 3.6 |
| 2.5 | 3.9 | 2.6 | 3.9 |
| 3.3 | 3.1 | 3.2 | 2.7 |
| 3.8 | 3.4 | 3.2 | 2.5 |
Use a significance level of 5%, and determine if there is a difference in GPA among the teams.
With a p -value of 0.9271, we decline to reject the null hypothesis. There is not sufficient evidence to conclude that there is a difference among the GPAs for the sports teams.
A fourth grade class is studying the environment. One of the assignments is to grow bean plants in different soils. Tommy chose to grow his bean plants in soil found outside his classroom mixed with dryer lint. Tara chose to grow her bean plants in potting soil bought at the local nursery. Nick chose to grow his bean plants in soil from his mother's garden. No chemicals were used on the plants, only water. They were grown inside the classroom next to a large window. Each child grew five plants. At the end of the growing period, each plant was measured, producing the data (in inches) in [link] .
| Tommy's Plants | Tara's Plants | Nick's Plants |
|---|---|---|
| 24 | 25 | 23 |
| 21 | 31 | 27 |
| 23 | 23 | 22 |
| 30 | 20 | 30 |
| 23 | 28 | 20 |
Does it appear that the three media in which the bean plants were grown produce the same mean height? Test at a 3% level of significance.
This time, we will perform the calculations that lead to the F' statistic. Notice that each group has the same number of plants, so we will use the formula F' = .
First, calculate the sample mean and sample variance of each group.
| Tommy's Plants | Tara's Plants | Nick's Plants | |
|---|---|---|---|
| Sample Mean | 24.2 | 25.4 | 24.4 |
| Sample Variance | 11.7 | 18.3 | 16.3 |
Next, calculate the variance of the three group means (Calculate the variance of 24.2, 25.4, and 24.4). Variance of the group means = 0.413 =
Then MS between = = (5)(0.413) where n = 5 is the sample size (number of plants each child grew).
Calculate the mean of the three sample variances (Calculate the mean of 11.7, 18.3, and 16.3). Mean of the sample variances = 15.433 = s 2 pooled
Then MS within = s 2 pooled = 15.433.
The F statistic (or F ratio) is
The dfs for the numerator = the number of groups – 1 = 3 – 1 = 2.
The dfs for the denominator = the total number of samples – the number of groups = 15 – 3 = 12
The distribution for the test is F 2,12 and the F statistic is F = 0.134
The p -value is P ( F >0.134) = 0.8759.
Decision: Since α = 0.03 and the p -value = 0.8759, then you cannot reject H 0 . (Why?)
Conclusion: With a 3% level of significance, from the sample data, the evidence is not sufficient to conclude that the mean heights of the bean plants are different.
The notation for the F distribution is F ~ F df ( num ), df ( denom )
where df ( num ) = df between and df ( denom ) = df within
The mean for the F distribution is
Tomato Data, Marist College School of Science (unpublished student research)
Analysis of variance compares the means of a response variable for several groups. ANOVA compares the variation within each group to the variation of the mean of each group. The ratio of these two is the F statistic from an F distribution with (number of groups – 1) as the numerator degrees of freedom and (number of observations – number of groups) as the denominator degrees of freedom. These statistics are summarized in the ANOVA table.
df between = df ( num ) = k – 1
df within = df(denom) = n – k
MS between =
MS within =
F =
Use the following information to answer the next eight exercises. Groups of men from three different areas of the country are to be tested for mean weight. The entries in the table are the weights for the different groups. The one-way ANOVA results are shown in [link] .
| Group 1 | Group 2 | Group 3 |
|---|---|---|
| 216 | 202 | 170 |
| 198 | 213 | 165 |
| 240 | 284 | 182 |
| 187 | 228 | 197 |
| 176 | 210 | 201 |
What is the Sum of Squares Factor?
4,939.2
What is the Sum of Squares Error?
What is the df for the numerator?
2
What is the df for the denominator?
What is the Mean Square Factor?
2,469.6
What is the Mean Square Error?
What is the F statistic?
3.7416
Use the following information to answer the next eight exercises. Girls from four different soccer teams are to be tested for mean goals scored per game. The entries in the table are the goals per game for the different teams. The one-way ANOVA results are shown in
[link] .
| Team 1 | Team 2 | Team 3 | Team 4 |
|---|---|---|---|
| 1 | 2 | 0 | 3 |
| 2 | 3 | 1 | 4 |
| 0 | 2 | 1 | 4 |
| 3 | 4 | 0 | 3 |
| 2 | 4 | 0 | 2 |
What is SS between ?
What is the df for the numerator?
3
What is MS between ?
What is SS within ?
13.2
What is the df for the denominator?
What is MS within ?
0.825
What is the F statistic?
Judging by the F statistic, do you think it is likely or unlikely that you will reject the null hypothesis?
Because a one-way ANOVA test is always right-tailed, a high F statistic corresponds to a low p -value, so it is likely that we cannot accept the null hypothesis.
Notification Switch
Would you like to follow the 'Business statistics -- bsta 200 -- humber college -- version 2016reva -- draft 2016-04-04' conversation and receive update notifications?

|
|

|
|

|
|

|
|

|
|

|
|

|
|

|
|

|
|

|