<< Chapter < Page Chapter >> Page >
By the end of this section, you will be able to:
  • Identify the neoclassical zone, the intermediate zone, and the Keynesian zone in the aggregate demand/aggregate supply model
  • Use an aggregate demand/aggregate supply model as a diagnostic test to understand the current state of the economy

The AD/AS model can be used to illustrate both Say’s law    that supply creates its own demand and Keynes’ law    that demand creates its own supply. Consider the three zones of the SRAS curve as identified in [link] : the Keynesian zone, the neoclassical zone, and the intermediate zone.

Keynes, neoclassical, and intermediate zones in the aggregate supply curve

The graph shows three aggregate demand curves to represent different zones: the Keynesian zone, intermediate zone, and neoclassical zone. The Keynesian is furthest to the left as well as the lowest; the intermediate zone is the center of the three curves; the neoclassical zone is the furthest to the right as well as the highest.
Near the equilibrium Ek, in the Keynesian zone at the far left of the SRAS curve, small shifts in AD, either to the right or the left, will affect the output level Yk, but will not much affect the price level. In the Keynesian zone, AD largely determines the quantity of output. Near the equilibrium En, in the neoclassical zone at the far right of the SRAS curve, small shifts in AD, either to the right or the left, will have relatively little effect on the output level Yn, but instead will have a greater effect on the price level. In the neoclassical zone, the near-vertical SRAS curve close to the level of potential GDP largely determines the quantity of output. In the intermediate zone around equilibrium Ei, movement in AD to the right will increase both the output level and the price level, while a movement in AD to the left would decrease both the output level and the price level.

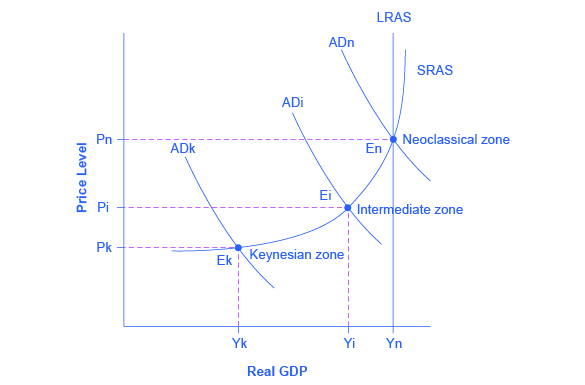
Focus first on the Keynesian zone    , that portion of the SRAS curve on the far left which is relatively flat. If the AD curve crosses this portion of the SRAS curve at an equilibrium point like Ek, then certain statements about the economic situation will follow. In the Keynesian zone, the equilibrium level of real GDP is far below potential GDP, the economy is in recession, and cyclical unemployment is high. If aggregate demand shifted to the right or left in the Keynesian zone, it will determine the resulting level of output (and thus unemployment). However, inflationary price pressure is not much of a worry in the Keynesian zone, since the price level does not vary much in this zone.

Now, focus your attention on the neoclassical zone    of the SRAS curve, which is the near-vertical portion on the right-hand side. If the AD curve crosses this portion of the SRAS curve at an equilibrium point like En where output is at or near potential GDP, then the size of potential GDP pretty much determines the level of output in the economy. Since the equilibrium is near potential GDP, cyclical unemployment is low in this economy, although structural unemployment may remain an issue. In the neoclassical zone, shifts of aggregate demand to the right or the left have little effect on the level of output or employment. The only way to increase the size of the real GDP in the neoclassical zone is for AS to shift to the right. However, shifts in AD in the neoclassical zone will create pressures to change the price level.

Questions & Answers

how do you get the 2/50
Abba Reply
number of sport play by 50 student construct discrete data
Aminu Reply
width of the frangebany leaves on how to write a introduction
Theresa Reply
Solve the mean of variance
Veronica Reply
Step 1: Find the mean. To find the mean, add up all the scores, then divide them by the number of scores. ... Step 2: Find each score's deviation from the mean. ... Step 3: Square each deviation from the mean. ... Step 4: Find the sum of squares. ... Step 5: Divide the sum of squares by n – 1 or N.
kenneth
what is error
Yakuba Reply
Is mistake done to something
Vutshila
Hy
anas
hy
What is the life teble
anas
hy
Jibrin
statistics is the analyzing of data
Tajudeen Reply
what is statics?
Zelalem Reply
how do you calculate mean
Gloria Reply
diveving the sum if all values
Shaynaynay
let A1,A2 and A3 events be independent,show that (A1)^c, (A2)^c and (A3)^c are independent?
Fisaye Reply
what is statistics
Akhisani Reply
data collected all over the world
Shaynaynay
construct a less than and more than table
Imad Reply
The sample of 16 students is taken. The average age in the sample was 22 years with astandard deviation of 6 years. Construct a 95% confidence interval for the age of the population.
Aschalew Reply
Bhartdarshan' is an internet-based travel agency wherein customer can see videos of the cities they plant to visit. The number of hits daily is a normally distributed random variable with a mean of 10,000 and a standard deviation of 2,400 a. what is the probability of getting more than 12,000 hits? b. what is the probability of getting fewer than 9,000 hits?
Akshay Reply
Bhartdarshan'is an internet-based travel agency wherein customer can see videos of the cities they plan to visit. The number of hits daily is a normally distributed random variable with a mean of 10,000 and a standard deviation of 2,400. a. What is the probability of getting more than 12,000 hits
Akshay
1
Bright
Sorry i want to learn more about this question
Bright
Someone help
Bright
a= 0.20233 b=0.3384
Sufiyan
a
Shaynaynay
How do I interpret level of significance?
Mohd Reply
It depends on your business problem or in Machine Learning you could use ROC- AUC cruve to decide the threshold value
Shivam
how skewness and kurtosis are used in statistics
Owen Reply
yes what is it
Taneeya
Got questions? Join the online conversation and get instant answers!
Jobilize.com Reply

Get Jobilize Job Search Mobile App in your pocket Now!

Get it on Google Play Download on the App Store Now


Source:  OpenStax, Principles of macroeconomics for ap® courses. OpenStax CNX. Aug 24, 2015 Download for free at http://legacy.cnx.org/content/col11864/1.2
Google Play and the Google Play logo are trademarks of Google Inc.

Notification Switch

Would you like to follow the 'Principles of macroeconomics for ap® courses' conversation and receive update notifications?

Ask