<< Chapter < Page Chapter >> Page >
The creation of this content was supported in some part by NSF grant 0538934.

Case structure

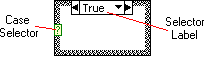
The case structure allows data to flow based on a integer, Boolean or string matching condition. The case executed is selected based on the data wired to the Case Selector .

A screen capture of a 'Case Structure' icon. The 'Case Selector' is labeled on the left and the 'Selector Label' is on the right.
Case Structure

Boolean selection

In the Front Panel window, select a Boolean control and an output string.

A case selection user interface screen cap. There is 'Boolean' button and a 'Case' field.
Case Selection User Interface

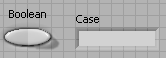
Arrange the diagram to look as in [link] .

A row of three icons. From left to right the icons are a boolean icon, a box icon with the word 'true' at the top, and the third icon is a case icon.
Case Selection G Diagram

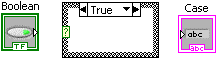
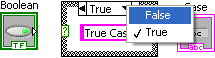
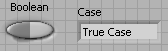
In the True case, add a string constant containing True Case .

A row of three icons. From left to right the icons are a boolean icon, a box icon with the word 'true' at the top and a pink box in the middle containing 'true case', and the third icon is a case icon.
True Case Diagram

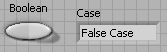
To select the False case, click on the selector label down arrow and select False from the pop-up menu. You can also cycle through the cases by clicking the next (right) or previous (left) arrows.

A row of three icons. From left to right the icons are a boolean icon, a box icon with the word 'true' at the top and a pick box containing 'true case'. There is also a menu on top of this second icon with 'false' highlighted in blue and a check mark next to 'true'. The third icon is a case icon.
Selecting False Case

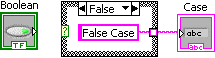
In the False case, add a string constant containing False Case .

A row of three icons. From left to right the icons are a boolean icon, a box icon with the word 'false' at the top and a pick box containing 'false case'. The third icon is a case icon.
False Case Diagram

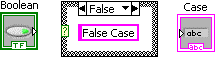
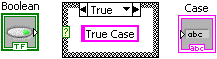
Wire the string constant in the case structure to the output string terminal.

A row of three icons. From left to right the icons are a boolean icon, a box icon with the word 'false' at the top and a pick box containing 'false case'. A pink line connects the second icon to the third icon which is a case icon.
Wiring Case Structures

Select the True case and wire the string constant to the case structure tunnel . Complete the diagram as shown in [link] .

A row of three icons. From left to right the icons are a boolean icon connect via a green line to a box icon with the word 'true' at the top and a pick box containing 'true case'. A pink line connects the second icon to the third icon which is a case icon.
Completed Case Diagram

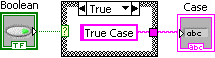
It is important to note that all instances in a case structure must be wired to enable data to flow from the case structure .

In the Front Panel window, toggle the Boolean input control and run the program.

A field with a Boolean button and a case field containing 'Flase Case'.
False Selection
A field with a Boolean button and a case field containing 'True Case'.
True Selection

Multicase selection

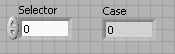
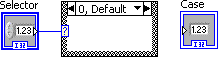
Select an Integer 32 numeric input and an Integer 32 numeric output and label them Selector and Case respectively.

A form containing the field 'sector' and the field 'case'. Each field contains 0.
Multicase GUI

In the Block Diagram window, create a case structure , select the False case and arrange the terminals as shown in [link] .

There are three icons. From left to right the icon are a 'sector' icon, a box with 'false' on top and the third icon is a 'case' icon.
Multicase

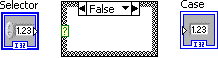
Wire the Selector numeric control to the case selector on the case structure. The selector label reflects the diagram update.

There are three icons. From left to right the icons are a 'sector' icon connected via a blue line to a box with '0, Default' on top and the third icon is a 'case' icon.
Multicase Selector

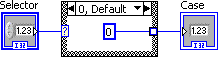
In the 0, Default case, add a numeric constant and leave its value as 0.

There are three icons. From left to right the icons are a 'sector' icon connected via a blue line to a box with '0, Default' on top and their is a '0' in the middle. This box is connected to the third icon which is a 'case' icon.
Default Case

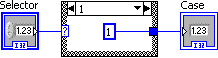
Using the selector label , select case 1. Add a numeric constant, enter 1 and wire it to the case tunnel. The resulting diagram is shown in [link] .

There are three icons. From left to right the icons are a 'sector' icon connected via a blue line to a box with '1' on top and their is a '1' in the middle. This box is connected to the third icon which is a 'case' icon.
Case 1

Right click anywhere in the case structure and select Add Case After from the pop-up menu.

A row of icons with a menu overlaid. From left to right there is an icon labeled 'sector' connected to a large box via a blue line. The item 'Add Case After' is highlighted in blue on the menu.
Adding Cases

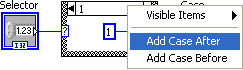
Case 2 is added after case 1. Add a numeric constant, enter 2 and wire it to the case structure tunnel.

There are three icons. From left to right the icons are a 'sector' icon connected via a blue line to a box with '2' on top and their is a '2' in the middle. This box is connected to the third icon which is a 'case' icon.
Case 2

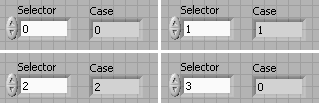
[link] shows the results of running this simple case selection programs for Selector set to 0, 1, 2 and 3 respectively.

There are four forms with the fields 'Sector' and 'Case' on each. Clockwise from top left the values in 'sector' 'case' pairs are '0,0', '1,1', '2,2' and '3,0'.
Multicase Selection Program

For loop

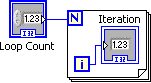
The For Loop structure repeatedly executes the diagram within the structure. The Loop Count specifies the number of times the loop contents must be executed and the Loop Iteration indicates which iteration is currently being executed.

An icon containing a blue square with an 'N' in the top left corner that is labeled 'Loop Count'. Another blue square containing 'i' is near the bottom left of the box and is labeled 'Loop Iteration'.
For Loop Structure

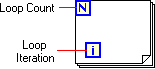
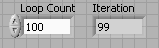
The Loop Count and Loop Iteration are of Integer 32 data types. If the Loop Count is set to N , then the Loop Iteration value range is from 0 to N-1 . This is illustrated in [link] and [link] .

A blue box labeled 'Loop Count' connects to a box with a blue box containing 'N' at the top left and a blue box containing 'i' at the bottom left. The 'i' box is connected within the big box to an icon labeled 'Iteration'.
Loop Count

A form with the field 'loop count' with a value of '100' and the field 'iteration' with a value of '99'.
Final Loop Iteration

Shift registers

Shift Registers allow the preservation of intermediate results between sequences of iterations.

A large box containg a blue box 'N' and a blue box 'i'. A pair of two down arrows are labeled 'shift registers'. An up arrow is opposite the down arrows.
Shift Registers
A large box containg a blue box 'N' and a blue box 'i'. A pair of two down arrows are labeled from top to bottom 'i-1' and 'i-2' and collectively they are labeled 'result at iteration'. An up arrow is opposite the down arrows and is labeled 'i' and 'Result at iteration'.
Shift Registers

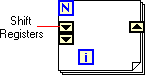
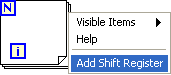
To add a Shift Register , right click on the For Loop structure and select Add Shift Register from the pop-up menu.

A large box with an blue box 'N' at the upper left corner and an 'i' in a blue box at the lower left. A menu exists on the right with the item 'Add Shift Register' is highlighted in blue.
Adding Shift Registers

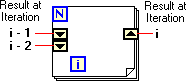
To add elements to the shift register , right click on the shift register and select Add Element from the pop-up menu.

Questions & Answers

differentiate between demand and supply giving examples
Lambiv Reply
differentiated between demand and supply using examples
Lambiv
what is labour ?
Lambiv
how will I do?
Venny Reply
how is the graph works?I don't fully understand
Rezat Reply
information
Eliyee
devaluation
Eliyee
t
WARKISA
hi guys good evening to all
Lambiv
multiple choice question
Aster Reply
appreciation
Eliyee
explain perfect market
Lindiwe Reply
In economics, a perfect market refers to a theoretical construct where all participants have perfect information, goods are homogenous, there are no barriers to entry or exit, and prices are determined solely by supply and demand. It's an idealized model used for analysis,
Ezea
What is ceteris paribus?
Shukri Reply
other things being equal
AI-Robot
When MP₁ becomes negative, TP start to decline. Extuples Suppose that the short-run production function of certain cut-flower firm is given by: Q=4KL-0.6K2 - 0.112 • Where is quantity of cut flower produced, I is labour input and K is fixed capital input (K-5). Determine the average product of lab
Kelo
Extuples Suppose that the short-run production function of certain cut-flower firm is given by: Q=4KL-0.6K2 - 0.112 • Where is quantity of cut flower produced, I is labour input and K is fixed capital input (K-5). Determine the average product of labour (APL) and marginal product of labour (MPL)
Kelo
yes,thank you
Shukri
Can I ask you other question?
Shukri
what is monopoly mean?
Habtamu Reply
What is different between quantity demand and demand?
Shukri Reply
Quantity demanded refers to the specific amount of a good or service that consumers are willing and able to purchase at a give price and within a specific time period. Demand, on the other hand, is a broader concept that encompasses the entire relationship between price and quantity demanded
Ezea
ok
Shukri
how do you save a country economic situation when it's falling apart
Lilia Reply
what is the difference between economic growth and development
Fiker Reply
Economic growth as an increase in the production and consumption of goods and services within an economy.but Economic development as a broader concept that encompasses not only economic growth but also social & human well being.
Shukri
production function means
Jabir
What do you think is more important to focus on when considering inequality ?
Abdisa Reply
any question about economics?
Awais Reply
sir...I just want to ask one question... Define the term contract curve? if you are free please help me to find this answer 🙏
Asui
it is a curve that we get after connecting the pareto optimal combinations of two consumers after their mutually beneficial trade offs
Awais
thank you so much 👍 sir
Asui
In economics, the contract curve refers to the set of points in an Edgeworth box diagram where both parties involved in a trade cannot be made better off without making one of them worse off. It represents the Pareto efficient allocations of goods between two individuals or entities, where neither p
Cornelius
In economics, the contract curve refers to the set of points in an Edgeworth box diagram where both parties involved in a trade cannot be made better off without making one of them worse off. It represents the Pareto efficient allocations of goods between two individuals or entities,
Cornelius
Suppose a consumer consuming two commodities X and Y has The following utility function u=X0.4 Y0.6. If the price of the X and Y are 2 and 3 respectively and income Constraint is birr 50. A,Calculate quantities of x and y which maximize utility. B,Calculate value of Lagrange multiplier. C,Calculate quantities of X and Y consumed with a given price. D,alculate optimum level of output .
Feyisa Reply
Answer
Feyisa
c
Jabir
the market for lemon has 10 potential consumers, each having an individual demand curve p=101-10Qi, where p is price in dollar's per cup and Qi is the number of cups demanded per week by the i th consumer.Find the market demand curve using algebra. Draw an individual demand curve and the market dema
Gsbwnw Reply
suppose the production function is given by ( L, K)=L¼K¾.assuming capital is fixed find APL and MPL. consider the following short run production function:Q=6L²-0.4L³ a) find the value of L that maximizes output b)find the value of L that maximizes marginal product
Abdureman
types of unemployment
Yomi Reply
What is the difference between perfect competition and monopolistic competition?
Mohammed
Got questions? Join the online conversation and get instant answers!
Jobilize.com Reply

Get Jobilize Job Search Mobile App in your pocket Now!

Get it on Google Play Download on the App Store Now


Source:  OpenStax, Introduction to g programming. OpenStax CNX. Mar 15, 2010 Download for free at http://cnx.org/content/col11192/1.1
Google Play and the Google Play logo are trademarks of Google Inc.

Notification Switch

Would you like to follow the 'Introduction to g programming' conversation and receive update notifications?

Ask