<< Chapter < Page Chapter >> Page >
An overview of the chapter contexts for our Grade 10 Physical Science WebBooks.

Overview of chapters

Units

This chapter explains the huge role measuring plays in the Physical Sciences and the importance of units. Examples given illustrate that experiment and observation becomes meaningful when expressed in a quantity and its particular unit. The SI unit system with its seven base SI units is introduced. Details are provided for the correct way to write units and their abbreviations. For example: the SI unit for length is meter (lower case) and the abbreviation is “m”, while the volume of a liquid is measured in litre “ℓ”. When a unit is named after a person, then the symbol is a capital letter. The ‘newton’ is the unit of force named after Sir Isaac Newton and its symbol is “N”. When writing a combination of base SI units, place a dot (·) between the base units used. Metres per second is correctly written as m · s 1 . “m·s^-1”.

Currently learners are expected to round off correctly to 2 decimal places. The text in the learner's book illustrates the big difference to the answer when rounding off digits during a calculation. As an educator you often need to remind your learners only to round off the final answer. Learners also need to be able to write and translate data into the correct units and dimensions using scientific notation. To develop learners’ skills to do conversions and calculations use the table of unit prefixes, conversion diagrams and worked examples.

Chemistry overview

Matter and materials

What are the objects around us made of?

Learners will learn that all objects are made of matter, and that different objects are made of different types of matter or materials. These different properties will be explained by studying material’s microscopic structure (the small parts that make up the material). We will explore the smallest building blocks of matter, atoms, their unique properties and how they interact and combine with other atoms.

Revision of concepts related to molecules, their molecular and empirical formulae, and models to represent compounds will assure that all learners have the necessary prior knowledge to understand new concepts.

Classification of matter

To link to Grade 9, matter is classified according to its different properties. The diagram below summarises the sequence in which content, concepts and skills are developed in this chapter.

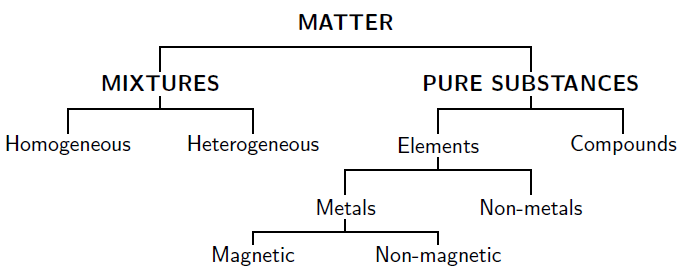
Diagram: the Classification of Matter

The terms: mixture, heterogeneous and homogeneous mixtures are defined and explained in a learner-friendly way. To clarify concepts and support understanding, a lot of interesting examples linked to everyday lifestyle are given. For example: a pizza is described as a heterogeneous mixture, as each slice of pizza will probably differ from the next one, because the toppings like cheese, tomato, mushrooms and peppers are not evenly distributed and are visible. Ways to separate mixtures is extended by explaining the dialysis process and how centrifugation is used to separate cells and plasma in blood.

Questions & Answers

What is inflation
Bright Reply
a general and ongoing rise in the level of prices in an economy
AI-Robot
What are the factors that affect demand for a commodity
Florence Reply
differentiate between demand and supply giving examples
Lambiv Reply
differentiated between demand and supply using examples
Lambiv
what is labour ?
Lambiv
how will I do?
Venny Reply
how is the graph works?I don't fully understand
Rezat Reply
information
Eliyee
devaluation
Eliyee
t
WARKISA
hi guys good evening to all
Lambiv
multiple choice question
Aster Reply
appreciation
Eliyee
explain perfect market
Lindiwe Reply
In economics, a perfect market refers to a theoretical construct where all participants have perfect information, goods are homogenous, there are no barriers to entry or exit, and prices are determined solely by supply and demand. It's an idealized model used for analysis,
Ezea
What is ceteris paribus?
Shukri Reply
other things being equal
AI-Robot
When MP₁ becomes negative, TP start to decline. Extuples Suppose that the short-run production function of certain cut-flower firm is given by: Q=4KL-0.6K2 - 0.112 • Where is quantity of cut flower produced, I is labour input and K is fixed capital input (K-5). Determine the average product of lab
Kelo
Extuples Suppose that the short-run production function of certain cut-flower firm is given by: Q=4KL-0.6K2 - 0.112 • Where is quantity of cut flower produced, I is labour input and K is fixed capital input (K-5). Determine the average product of labour (APL) and marginal product of labour (MPL)
Kelo
yes,thank you
Shukri
Can I ask you other question?
Shukri
what is monopoly mean?
Habtamu Reply
What is different between quantity demand and demand?
Shukri Reply
Quantity demanded refers to the specific amount of a good or service that consumers are willing and able to purchase at a give price and within a specific time period. Demand, on the other hand, is a broader concept that encompasses the entire relationship between price and quantity demanded
Ezea
ok
Shukri
how do you save a country economic situation when it's falling apart
Lilia Reply
what is the difference between economic growth and development
Fiker Reply
Economic growth as an increase in the production and consumption of goods and services within an economy.but Economic development as a broader concept that encompasses not only economic growth but also social & human well being.
Shukri
production function means
Jabir
What do you think is more important to focus on when considering inequality ?
Abdisa Reply
any question about economics?
Awais Reply
sir...I just want to ask one question... Define the term contract curve? if you are free please help me to find this answer 🙏
Asui
it is a curve that we get after connecting the pareto optimal combinations of two consumers after their mutually beneficial trade offs
Awais
thank you so much 👍 sir
Asui
In economics, the contract curve refers to the set of points in an Edgeworth box diagram where both parties involved in a trade cannot be made better off without making one of them worse off. It represents the Pareto efficient allocations of goods between two individuals or entities, where neither p
Cornelius
In economics, the contract curve refers to the set of points in an Edgeworth box diagram where both parties involved in a trade cannot be made better off without making one of them worse off. It represents the Pareto efficient allocations of goods between two individuals or entities,
Cornelius
Suppose a consumer consuming two commodities X and Y has The following utility function u=X0.4 Y0.6. If the price of the X and Y are 2 and 3 respectively and income Constraint is birr 50. A,Calculate quantities of x and y which maximize utility. B,Calculate value of Lagrange multiplier. C,Calculate quantities of X and Y consumed with a given price. D,alculate optimum level of output .
Feyisa Reply
Answer
Feyisa
c
Jabir
Got questions? Join the online conversation and get instant answers!
Jobilize.com Reply

Get Jobilize Job Search Mobile App in your pocket Now!

Get it on Google Play Download on the App Store Now


Source:  OpenStax, Physical science grade 10 teachers' guide - siyavula webbook. OpenStax CNX. Aug 10, 2011 Download for free at http://cnx.org/content/col11342/1.1
Google Play and the Google Play logo are trademarks of Google Inc.

Notification Switch

Would you like to follow the 'Physical science grade 10 teachers' guide - siyavula webbook' conversation and receive update notifications?

Ask