<< Chapter < Page Chapter >> Page >

One common line graph is called a time series , in which the horizontal axis shows time and the vertical axis displays another variable. Thus, a time series graph shows how a variable changes over time. [link] shows the unemployment rate in the United States since 1975, where unemployment is defined as the percentage of adults who want jobs and are looking for a job, but cannot find one. The points for the unemployment rate in each year are plotted on the graph, and a line then connects the points, showing how the unemployment rate has moved up and down since 1975. The line graph makes it easy to see, for example, that the highest unemployment rate during this time period was slightly less than 10% in the early 1980s and 2010, while the unemployment rate declined from the early 1990s to the end of the 1990s, before rising and then falling back in the early 2000s, and then rising sharply during the recession from 2008–2009.
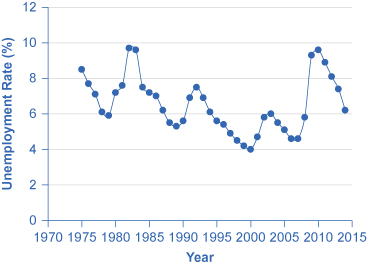
U.s. unemployment rate, 1975–2014

The graph shows unemployment rates since 1970. The highest rates occurred around 1983 and 2010.
This graph provides a quick visual summary of unemployment data. With a graph like this, it is easy to spot the times of high unemployment and of low unemployment.

Pie Graphs

A pie graph (sometimes called a pie chart ) is used to show how an overall total is divided into parts. A circle represents a group as a whole. The slices of this circular “pie” show the relative sizes of subgroups.

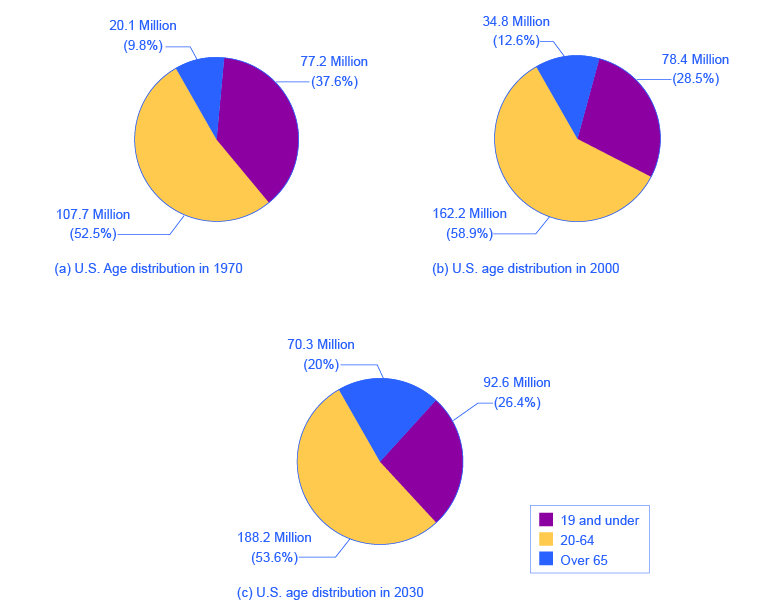
[link] shows how the U.S. population was divided among children, working age adults, and the elderly in 1970, 2000, and what is projected for 2030. The information is first conveyed with numbers in [link] , and then in three pie charts. The first column of [link] shows the total U.S. population for each of the three years. Columns 2–4 categorize the total in terms of age groups—from birth to 18 years, from 19 to 64 years, and 65 years and above. In columns 2–4, the first number shows the actual number of people in each age category, while the number in parentheses shows the percentage of the total population comprised by that age group.

U.s. age distribution, 1970, 2000, and 2030 (projected)
Year Total Population 19 and Under 20–64 years Over 65
1970 205.0 million 77.2 (37.6%) 107.7 (52.5%) 20.1 (9.8%)
2000 275.4 million 78.4 (28.5%) 162.2 (58.9%) 34.8 (12.6%)
2030 351.1 million 92.6 (26.4%) 188.2 (53.6%) 70.3 (20.0%)

Pie graphs of the u.s. age distribution (numbers in millions)

The image shows three pie graphs representing age distribution in the U.S. Image (a) shows that in 1970, people 19 and under made up 77.2 million or 37.6% of the population; people between ages 20 and 64 made up 107.7 million or 52.5% of the population; and people 65 or older made up 20.1 million or 9.8% of the population. Image (b) shows that in 2000, people 19 and under made up 78.4 million or 28.5% of the population; people between ages 20 and 64 made up 162.2 million or 58.9% of the population; and people 65 or older made up 34.8 million or 12.6% of the population. Image (c) projects that in 2030, people 19 and under will make up 92.6 million or 26.4% of the population; people between ages 20 and 64 made up 188.2 million or 53.6% of the population; and people 65 or older made up 70.3 million or 20% of the population.
The three pie graphs illustrate the division of total population into three age groups for the three different years.

In a pie graph, each slice of the pie represents a share of the total, or a percentage. For example, 50% would be half of the pie and 20% would be one-fifth of the pie. The three pie graphs in [link] show that the share of the U.S. population 65 and over is growing. The pie graphs allow you to get a feel for the relative size of the different age groups from 1970 to 2000 to 2030, without requiring you to slog through the specific numbers and percentages in the table. Some common examples of how pie graphs are used include dividing the population into groups by age, income level, ethnicity, religion, occupation; dividing different firms into categories by size, industry, number of employees; and dividing up government spending or taxes into its main categories.

Questions & Answers

calculate molarity of NaOH solution when 25.0ml of NaOH titrated with 27.2ml of 0.2m H2SO4
Gasin Reply
what's Thermochemistry
rhoda Reply
the study of the heat energy which is associated with chemical reactions
Kaddija
How was CH4 and o2 was able to produce (Co2)and (H2o
Edafe Reply
explain please
Victory
First twenty elements with their valences
Martine Reply
what is chemistry
asue Reply
what is atom
asue
what is the best way to define periodic table for jamb
Damilola Reply
what is the change of matter from one state to another
Elijah Reply
what is isolation of organic compounds
IKyernum Reply
what is atomic radius
ThankGod Reply
Read Chapter 6, section 5
Dr
Read Chapter 6, section 5
Kareem
Atomic radius is the radius of the atom and is also called the orbital radius
Kareem
atomic radius is the distance between the nucleus of an atom and its valence shell
Amos
Read Chapter 6, section 5
paulino
Bohr's model of the theory atom
Ayom Reply
is there a question?
Dr
when a gas is compressed why it becomes hot?
ATOMIC
It has no oxygen then
Goldyei
read the chapter on thermochemistry...the sections on "PV" work and the First Law of Thermodynamics should help..
Dr
Which element react with water
Mukthar Reply
Mgo
Ibeh
an increase in the pressure of a gas results in the decrease of its
Valentina Reply
definition of the periodic table
Cosmos Reply
What is the lkenes
Da Reply
what were atoms composed of?
Moses Reply
Got questions? Join the online conversation and get instant answers!
Jobilize.com Reply

Get Jobilize Job Search Mobile App in your pocket Now!

Get it on Google Play Download on the App Store Now


Source:  OpenStax, Principles of economics. OpenStax CNX. Sep 19, 2014 Download for free at http://legacy.cnx.org/content/col11613/1.11
Google Play and the Google Play logo are trademarks of Google Inc.

Notification Switch

Would you like to follow the 'Principles of economics' conversation and receive update notifications?

Ask