<< Chapter < Page Chapter >> Page >
By the end of this section, you will be able to:
  • Calculate the price elasticity of demand
  • Calculate the price elasticity of supply

Both the demand and supply curve show the relationship between price and the number of units demanded or supplied. Price elasticity is the ratio between the percentage change in the quantity demanded (Qd) or supplied (Qs) and the corresponding percent change in price. The price elasticity of demand    is the percentage change in the quantity demanded of a good or service divided by the percentage change in the price. The price elasticity of supply    is the percentage change in quantity supplied divided by the percentage change in price.

Elasticities can be usefully divided into three broad categories: elastic, inelastic, and unitary. An elastic demand    or elastic supply    is one in which the elasticity is greater than one, indicating a high responsiveness to changes in price. Elasticities that are less than one indicate low responsiveness to price changes and correspond to inelastic demand    or inelastic supply    . Unitary elasticities indicate proportional responsiveness of either demand or supply, as summarized in [link] .

Elastic, Inelastic, and Unitary: Three Cases of Elasticity
If . . . Then . . . And It Is Called . . .
% change in quantity > % change in price % change in quantity % change in price > 1 Elastic
% change in quantity = % change in price % change in quantity % change in price = 1 Unitary
% change in quantity < % change in price % change in quantity % change in price < 1 Inelastic

Before we get into the nitty gritty of elasticity, enjoy this article on elasticity and ticket prices at the Super Bowl.

To calculate elasticity, instead of using simple percentage changes in quantity and price, economists use the average percent change in both quantity and price. This is called the Midpoint Method for Elasticity, and is represented in the following equations:

% change in quantity = Q 2 Q 1 Q 2 + Q 1 /2  × 100 % change in price = P 2 P 1 P 2 + P 1 /2  × 100

The advantage of the is Midpoint Method is that one obtains the same elasticity between two price points whether there is a price increase or decrease. This is because the formula uses the same base for both cases.

Calculating price elasticity of demand

Let’s calculate the elasticity between points A and B and between points G and H shown in [link] .

Calculating the price elasticity of demand

The graph shows a downward sloping line that represents the price elasticity of demand.
The price elasticity of demand is calculated as the percentage change in quantity divided by the percentage change in price.

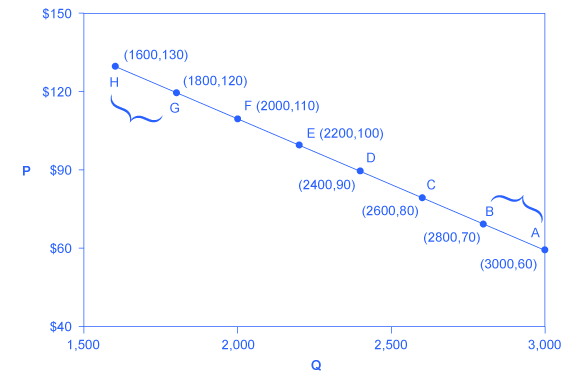
First, apply the formula to calculate the elasticity as price decreases from $70 at point B to $60 at point A:

% change in quantity = 3,000 2,800 ( 3,000 + 2,800 ) /2  × 100 = 200 2,900  × 100 = 6.9 % change in price = 60 70 ( 60 + 70 ) /2  × 100 = –10 65  × 100 = –15.4 Price Elasticity of Demand =     6.9% –15.4% = 0.45

Therefore, the elasticity of demand between these two points is     6.9% –15.4% which is 0.45, an amount smaller than one, showing that the demand is inelastic in this interval. Price elasticities of demand are always negative since price and quantity demanded always move in opposite directions (on the demand curve). By convention, we always talk about elasticities as positive numbers. So mathematically, we take the absolute value of the result. We will ignore this detail from now on, while remembering to interpret elasticities as positive numbers.

Questions & Answers

what does mean opportunity cost?
Aster Reply
what is poetive effect of population growth
Solomon Reply
what is inflation
Nasir Reply
what is demand
Eleni
what is economics
IMLAN Reply
economics theory describes individual behavior as the result of a process of optimization under constraints the objective to be reached being determined by
Kalkidan
Economics is a branch of social science that deal with How to wise use of resource ,s
Kassie
need
WARKISA
Economic Needs: In economics, needs are goods or services that are necessary for maintaining a certain standard of living. This includes things like healthcare, education, and transportation.
Kalkidan
What is demand and supply
EMPEROR Reply
deman means?
Alex
what is supply?
Alex
ex play supply?
Alex
Money market is a branch or segment of financial market where short-term debt instruments are traded upon. The instruments in this market includes Treasury bills, Bonds, Commercial Papers, Call money among other.
murana Reply
good
Kayode
what is money market
umar Reply
Examine the distinction between theory of comparative cost Advantage and theory of factor proportion
Fatima Reply
What is inflation
Bright Reply
a general and ongoing rise in the level of prices in an economy
AI-Robot
What are the factors that affect demand for a commodity
Florence Reply
price
Kenu
differentiate between demand and supply giving examples
Lambiv Reply
differentiated between demand and supply using examples
Lambiv
what is labour ?
Lambiv
how will I do?
Venny Reply
how is the graph works?I don't fully understand
Rezat Reply
information
Eliyee
devaluation
Eliyee
t
WARKISA
hi guys good evening to all
Lambiv
multiple choice question
Aster Reply
appreciation
Eliyee
explain perfect market
Lindiwe Reply
In economics, a perfect market refers to a theoretical construct where all participants have perfect information, goods are homogenous, there are no barriers to entry or exit, and prices are determined solely by supply and demand. It's an idealized model used for analysis,
Ezea

Get Jobilize Job Search Mobile App in your pocket Now!

Get it on Google Play Download on the App Store Now


Source:  OpenStax, Principles of economics. OpenStax CNX. Sep 19, 2014 Download for free at http://legacy.cnx.org/content/col11613/1.11
Google Play and the Google Play logo are trademarks of Google Inc.

Notification Switch

Would you like to follow the 'Principles of economics' conversation and receive update notifications?

Ask