<< Chapter < Page Chapter >> Page >
  • With a doubling time of 30 minutes and a starting population size of 1 × 10 5 cells, how many cells will be present after 2 hours, assuming no cell death?

The growth curve

Microorganisms grown in closed culture (also known as a batch culture ), in which no nutrients are added and most waste is not removed, follow a reproducible growth pattern referred to as the growth curve . An example of a batch culture in nature is a pond in which a small number of cells grow in a closed environment. The culture density is defined as the number of cells per unit volume. In a closed environment, the culture density is also a measure of the number of cells in the population. Infections of the body do not always follow the growth curve, but correlations can exist depending upon the site and type of infection. When the number of live cells is plotted against time, distinct phases can be observed in the curve ( [link] ).
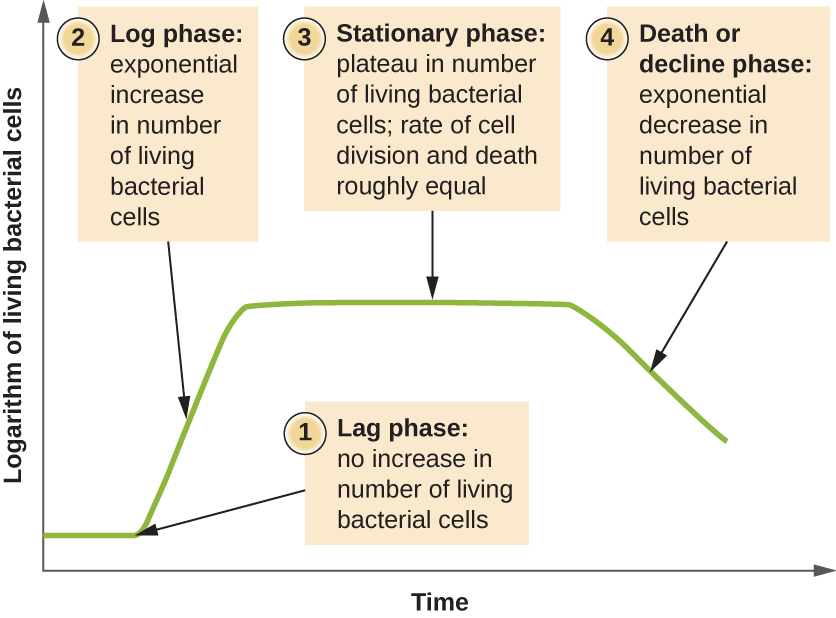
A graph with time on the X axis and logarithm of living bacterial cells on the Y axis. The line of the graph begins towards the bottom of the Y axis and is flat for a short time. This is labeled 1) lag phase: no increase in number of living bacterial cells. Next the line slopes upwards. This is labeled Log phase: exponential increase in number of living bacterial cells. Next the line flattens again. This is labeled 3) Stationary phase: plateau in number of living bacterial cells; rate of cell division and death roughly equal. Final the line slopes downwards. This is labeled 4) Death or decline phase: exponential decrease in number of living bacterial cells.
The growth curve of a bacterial culture is represented by the logarithm of the number of live cells plotted as a function of time. The graph can be divided into four phases according to the slope, each of which matches events in the cell. The four phases are lag, log, stationary, and death.

The lag phase

The beginning of the growth curve represents a small number of cells, referred to as an inoculum , that are added to a fresh culture medium , a nutritional broth that supports growth. The initial phase of the growth curve is called the lag phase , during which cells are gearing up for the next phase of growth. The number of cells does not change during the lag phase; however, cells grow larger and are metabolically active, synthesizing proteins needed to grow within the medium. If any cells were damaged or shocked during the transfer to the new medium, repair takes place during the lag phase. The duration of the lag phase is determined by many factors, including the species and genetic make-up of the cells, the composition of the medium, and the size of the original inoculum.

The log phase

In the logarithmic (log) growth phase , sometimes called exponential growth phase , the cells are actively dividing by binary fission and their number increases exponentially. For any given bacterial species, the generation time under specific growth conditions (nutrients, temperature, pH, and so forth) is genetically determined, and this generation time is called the intrinsic growth rate . During the log phase, the relationship between time and number of cells is not linear but exponential; however, the growth curve is often plotted on a semilogarithmic graph, as shown in [link] , which gives the appearance of a linear relationship.
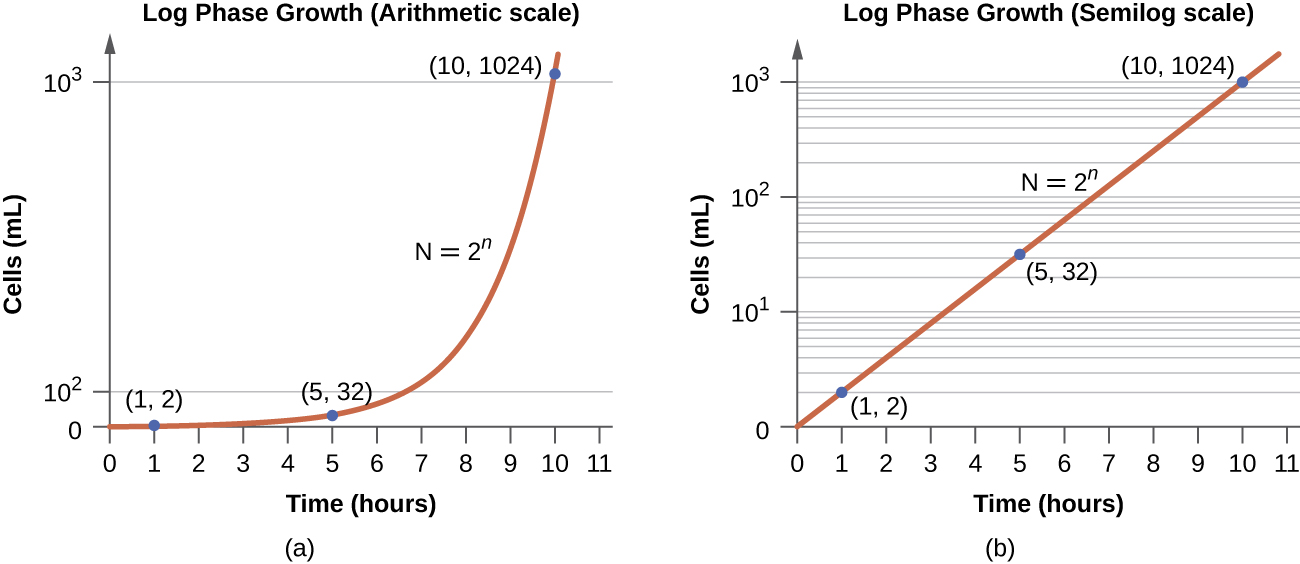
a) An arithmetic scale graph showing log phase growth. The X axis is time (hours) and the Y ais is cells per ml. The line on this graph starts fairly flat with readings of (1,2) and (5,32) but quickly slopes up steeply with a final reading of (10, 1024). B) is a semilog scale graph of log phase growth. Again the X axis is time (hours) and the Y axis is cells per ml. But the intervals of the Y axis more clearly show the difference between 10 superscript 1 and 10 superscript 3. The line on this graph is a straight line diagonally across the graph with points of (1,2), (5,32) and (10,1024) – just like the first graph. The equation for both graphs is N=2 superscript n.
Both graphs illustrate population growth during the log phase for a bacterial sample with an initial population of one cell and a doubling time of 1 hour. (a) When plotted on an arithmetic scale, the growth rate resembles a curve. (b) When plotted on a semilogarithmic scale (meaning the values on the y -axis are logarithmic), the growth rate appears linear.

Cells in the log phase show constant growth rate and uniform metabolic activity. For this reason, cells in the log phase are preferentially used for industrial applications and research work. The log phase is also the stage where bacteria are the most susceptible to the action of disinfectants and common antibiotics that affect protein, DNA, and cell-wall synthesis.

Questions & Answers

how do you get the 2/50
Abba Reply
number of sport play by 50 student construct discrete data
Aminu Reply
width of the frangebany leaves on how to write a introduction
Theresa Reply
Solve the mean of variance
Veronica Reply
Step 1: Find the mean. To find the mean, add up all the scores, then divide them by the number of scores. ... Step 2: Find each score's deviation from the mean. ... Step 3: Square each deviation from the mean. ... Step 4: Find the sum of squares. ... Step 5: Divide the sum of squares by n – 1 or N.
kenneth
what is error
Yakuba Reply
Is mistake done to something
Vutshila
Hy
anas
hy
What is the life teble
anas
hy
Jibrin
statistics is the analyzing of data
Tajudeen Reply
what is statics?
Zelalem Reply
how do you calculate mean
Gloria Reply
diveving the sum if all values
Shaynaynay
let A1,A2 and A3 events be independent,show that (A1)^c, (A2)^c and (A3)^c are independent?
Fisaye Reply
what is statistics
Akhisani Reply
data collected all over the world
Shaynaynay
construct a less than and more than table
Imad Reply
The sample of 16 students is taken. The average age in the sample was 22 years with astandard deviation of 6 years. Construct a 95% confidence interval for the age of the population.
Aschalew Reply
Bhartdarshan' is an internet-based travel agency wherein customer can see videos of the cities they plant to visit. The number of hits daily is a normally distributed random variable with a mean of 10,000 and a standard deviation of 2,400 a. what is the probability of getting more than 12,000 hits? b. what is the probability of getting fewer than 9,000 hits?
Akshay Reply
Bhartdarshan'is an internet-based travel agency wherein customer can see videos of the cities they plan to visit. The number of hits daily is a normally distributed random variable with a mean of 10,000 and a standard deviation of 2,400. a. What is the probability of getting more than 12,000 hits
Akshay
1
Bright
Sorry i want to learn more about this question
Bright
Someone help
Bright
a= 0.20233 b=0.3384
Sufiyan
a
Shaynaynay
How do I interpret level of significance?
Mohd Reply
It depends on your business problem or in Machine Learning you could use ROC- AUC cruve to decide the threshold value
Shivam
how skewness and kurtosis are used in statistics
Owen Reply
yes what is it
Taneeya
Got questions? Join the online conversation and get instant answers!
Jobilize.com Reply

Get Jobilize Job Search Mobile App in your pocket Now!

Get it on Google Play Download on the App Store Now


Source:  OpenStax, Microbiology. OpenStax CNX. Nov 01, 2016 Download for free at http://cnx.org/content/col12087/1.4
Google Play and the Google Play logo are trademarks of Google Inc.

Notification Switch

Would you like to follow the 'Microbiology' conversation and receive update notifications?

Ask