<< Chapter < Page Chapter >> Page >
  • Explain the differences between Koch’s original postulates and the molecular Koch’s postulates.

Pathogenicity and virulence

The ability of a microbial agent to cause disease is called pathogenicity , and the degree to which an organism is pathogenic is called virulence . Virulence is a continuum. On one end of the spectrum are organisms that are avirulent (not harmful) and on the other are organisms that are highly virulent. Highly virulent pathogens will almost always lead to a disease state when introduced to the body, and some may even cause multi-organ and body system failure in healthy individuals. Less virulent pathogens may cause an initial infection, but may not always cause severe illness. Pathogens with low virulence would more likely result in mild signs and symptoms of disease, such as low-grade fever, headache, or muscle aches. Some individuals might even be asymptomatic.

An example of a highly virulent microorganism is Bacillus anthracis , the pathogen responsible for anthrax . B. anthracis can produce different forms of disease, depending on the route of transmission (e.g., cutaneous injection, inhalation, ingestion). The most serious form of anthrax is inhalation anthrax. After B. anthracis spores are inhaled, they germinate. An active infection develops and the bacteria release potent toxins that cause edema (fluid buildup in tissues), hypoxia (a condition preventing oxygen from reaching tissues), and necrosis (cell death and inflammation). Signs and symptoms of inhalation anthrax include high fever, difficulty breathing, vomiting and coughing up blood, and severe chest pains suggestive of a heart attack. With inhalation anthrax, the toxins and bacteria enter the bloodstream, which can lead to multi-organ failure and death of the patient. If a gene (or genes) involved in pathogenesis is inactivated, the bacteria become less virulent or nonpathogenic.

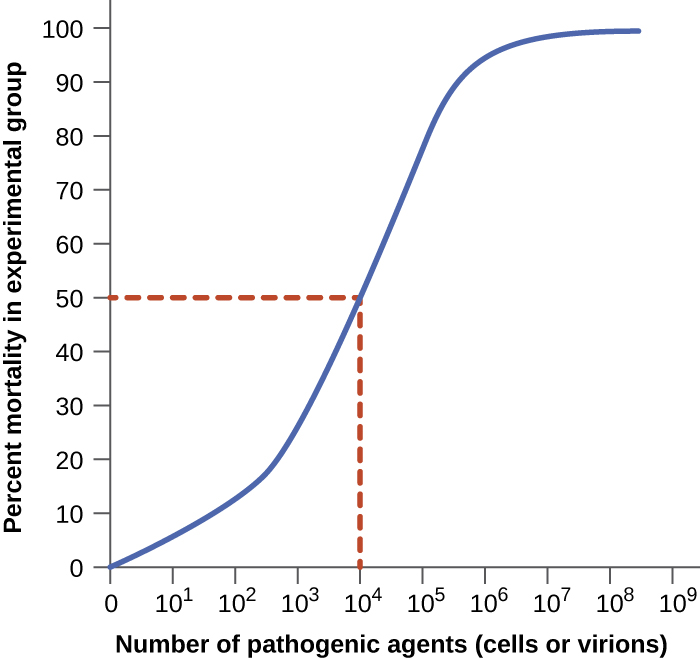
Virulence of a pathogen can be quantified using controlled experiments with laboratory animals. Two important indicators of virulence are the median infectious dose (ID 50 ) and the median lethal dose (LD 50 ) , both of which are typically determined experimentally using animal models. The ID 50 is the number of pathogen cells or virions required to cause active infection in 50% of inoculated animals. The LD 50 is the number of pathogenic cells, virions, or amount of toxin required to kill 50% of infected animals. To calculate these values, each group of animals is inoculated with one of a range of known numbers of pathogen cells or virions. In graphs like the one shown in [link] , the percentage of animals that have been infected (for ID 50 ) or killed (for LD 50 ) is plotted against the concentration of pathogen inoculated. [link] represents data graphed from a hypothetical experiment measuring the LD 50 of a pathogen. Interpretation of the data from this graph indicates that the LD 50 of the pathogen for the test animals is 10 4 pathogen cells or virions (depending upon the pathogen studied).

A graph with “number of pathogenic agents (cells or virions)” on the X axis and Percent mortality in experimental group on the Y axis. The graph begins at 0,0 and increases until there is nearly 100% death at 10 to the 5. The line then plateaus at 100%.  A 50% death rate occurs at 10 to the 4. This is the LD 50.
A graph like this is used to determine LD 50 by plotting pathogen concentration against the percent of infected test animals that have died. In this example, the LD 50 = 10 4 pathogenic particles.

Questions & Answers

differentiate between demand and supply giving examples
Lambiv Reply
differentiated between demand and supply using examples
Lambiv
what is labour ?
Lambiv
how will I do?
Venny Reply
how is the graph works?I don't fully understand
Rezat Reply
information
Eliyee
devaluation
Eliyee
t
WARKISA
hi guys good evening to all
Lambiv
multiple choice question
Aster Reply
appreciation
Eliyee
explain perfect market
Lindiwe Reply
In economics, a perfect market refers to a theoretical construct where all participants have perfect information, goods are homogenous, there are no barriers to entry or exit, and prices are determined solely by supply and demand. It's an idealized model used for analysis,
Ezea
What is ceteris paribus?
Shukri Reply
other things being equal
AI-Robot
When MP₁ becomes negative, TP start to decline. Extuples Suppose that the short-run production function of certain cut-flower firm is given by: Q=4KL-0.6K2 - 0.112 • Where is quantity of cut flower produced, I is labour input and K is fixed capital input (K-5). Determine the average product of lab
Kelo
Extuples Suppose that the short-run production function of certain cut-flower firm is given by: Q=4KL-0.6K2 - 0.112 • Where is quantity of cut flower produced, I is labour input and K is fixed capital input (K-5). Determine the average product of labour (APL) and marginal product of labour (MPL)
Kelo
yes,thank you
Shukri
Can I ask you other question?
Shukri
what is monopoly mean?
Habtamu Reply
What is different between quantity demand and demand?
Shukri Reply
Quantity demanded refers to the specific amount of a good or service that consumers are willing and able to purchase at a give price and within a specific time period. Demand, on the other hand, is a broader concept that encompasses the entire relationship between price and quantity demanded
Ezea
ok
Shukri
how do you save a country economic situation when it's falling apart
Lilia Reply
what is the difference between economic growth and development
Fiker Reply
Economic growth as an increase in the production and consumption of goods and services within an economy.but Economic development as a broader concept that encompasses not only economic growth but also social & human well being.
Shukri
production function means
Jabir
What do you think is more important to focus on when considering inequality ?
Abdisa Reply
any question about economics?
Awais Reply
sir...I just want to ask one question... Define the term contract curve? if you are free please help me to find this answer 🙏
Asui
it is a curve that we get after connecting the pareto optimal combinations of two consumers after their mutually beneficial trade offs
Awais
thank you so much 👍 sir
Asui
In economics, the contract curve refers to the set of points in an Edgeworth box diagram where both parties involved in a trade cannot be made better off without making one of them worse off. It represents the Pareto efficient allocations of goods between two individuals or entities, where neither p
Cornelius
In economics, the contract curve refers to the set of points in an Edgeworth box diagram where both parties involved in a trade cannot be made better off without making one of them worse off. It represents the Pareto efficient allocations of goods between two individuals or entities,
Cornelius
Suppose a consumer consuming two commodities X and Y has The following utility function u=X0.4 Y0.6. If the price of the X and Y are 2 and 3 respectively and income Constraint is birr 50. A,Calculate quantities of x and y which maximize utility. B,Calculate value of Lagrange multiplier. C,Calculate quantities of X and Y consumed with a given price. D,alculate optimum level of output .
Feyisa Reply
Answer
Feyisa
c
Jabir
the market for lemon has 10 potential consumers, each having an individual demand curve p=101-10Qi, where p is price in dollar's per cup and Qi is the number of cups demanded per week by the i th consumer.Find the market demand curve using algebra. Draw an individual demand curve and the market dema
Gsbwnw Reply
suppose the production function is given by ( L, K)=L¼K¾.assuming capital is fixed find APL and MPL. consider the following short run production function:Q=6L²-0.4L³ a) find the value of L that maximizes output b)find the value of L that maximizes marginal product
Abdureman
types of unemployment
Yomi Reply
What is the difference between perfect competition and monopolistic competition?
Mohammed
Got questions? Join the online conversation and get instant answers!
Jobilize.com Reply

Get Jobilize Job Search Mobile App in your pocket Now!

Get it on Google Play Download on the App Store Now


Source:  OpenStax, Microbiology. OpenStax CNX. Nov 01, 2016 Download for free at http://cnx.org/content/col12087/1.4
Google Play and the Google Play logo are trademarks of Google Inc.

Notification Switch

Would you like to follow the 'Microbiology' conversation and receive update notifications?

Ask