<< Chapter < Page Chapter >> Page >
A photograph of a wire model in a museum.
In 1953, James Watson and Francis Crick built this model of the structure of DNA, shown here on display at the Science Museum in London.
  • Which scientists are given most of the credit for describing the molecular structure of DNA?

Dna structure

Watson and Crick proposed that DNA is made up of two strands that are twisted around each other to form a right-handed helix. The two DNA strands are antiparallel , such that the 3ʹ end of one strand faces the 5ʹ end of the other ( [link] ). The 3ʹ end of each strand has a free hydroxyl group, while the 5ʹ end of each strand has a free phosphate group. The sugar and phosphate of the polymerized nucleotides form the backbone of the structure, whereas the nitrogenous bases are stacked inside. These nitrogenous bases on the interior of the molecule interact with each other, base pairing.

Analysis of the diffraction patterns of DNA has determined that there are approximately 10 bases per turn in DNA. The asymmetrical spacing of the sugar-phosphate backbones generates major grooves (where the backbone is far apart) and minor grooves (where the backbone is close together) ( [link] ). These grooves are locations where proteins can bind to DNA. The binding of these proteins can alter the structure of DNA, regulate replication , or regulate transcription of DNA into RNA.

a) A diagram of DNA shown as a double helix (a twisted ladder). The outside of the ladder is a blue ribbon labeled “sugar phosphate backbone”. The rungs of the ladder are labeled “base pair” and are either red and yellow or green and blue. Red indicates the nitrogenous base adenine. Yellow indicates the nitrogenous base thymine. Blue indicates the nitrogenous base guanine. Green indicates the nitrogenous base cytosine. The ladder twists so that there are wide spaces (called major grooves) and narrow spaces (called minor grooves) between the twists. B) A different diagram of DNA showing it as a straight ladder. This makes it easier to see the bases (which can now be labeled with the letters A, T, C or G directly on the image. The left strand has a 3-prime at the top and a 5-prime at the bottom. The right strand has a 5-prime at the top and a 3-prime at the bottom. C) Another diagram of DNA showing a much shorter segment which allows the chemical structures to be seen more clearly. The strands show that the phosphate group is always between carbon 3 of one nucleotide and carbon 5 of the next. The two strands are connected with dotted lines indicating hydrogen bonds. The A-T bond has 2 hydrogen bonds and C-G has 3 hydrogen bonds. The negative charge of the phosphates is also apparent.
Watson and Crick proposed the double helix model for DNA. (a) The sugar-phosphate backbones are on the outside of the double helix and purines and pyrimidines form the “rungs” of the DNA helix ladder. (b) The two DNA strands are antiparallel to each other. (c) The direction of each strand is identified by numbering the carbons (1 through 5) in each sugar molecule. The 5ʹ end is the one where carbon #5 is not bound to another nucleotide; the 3ʹ end is the one where carbon #3 is not bound to another nucleotide.

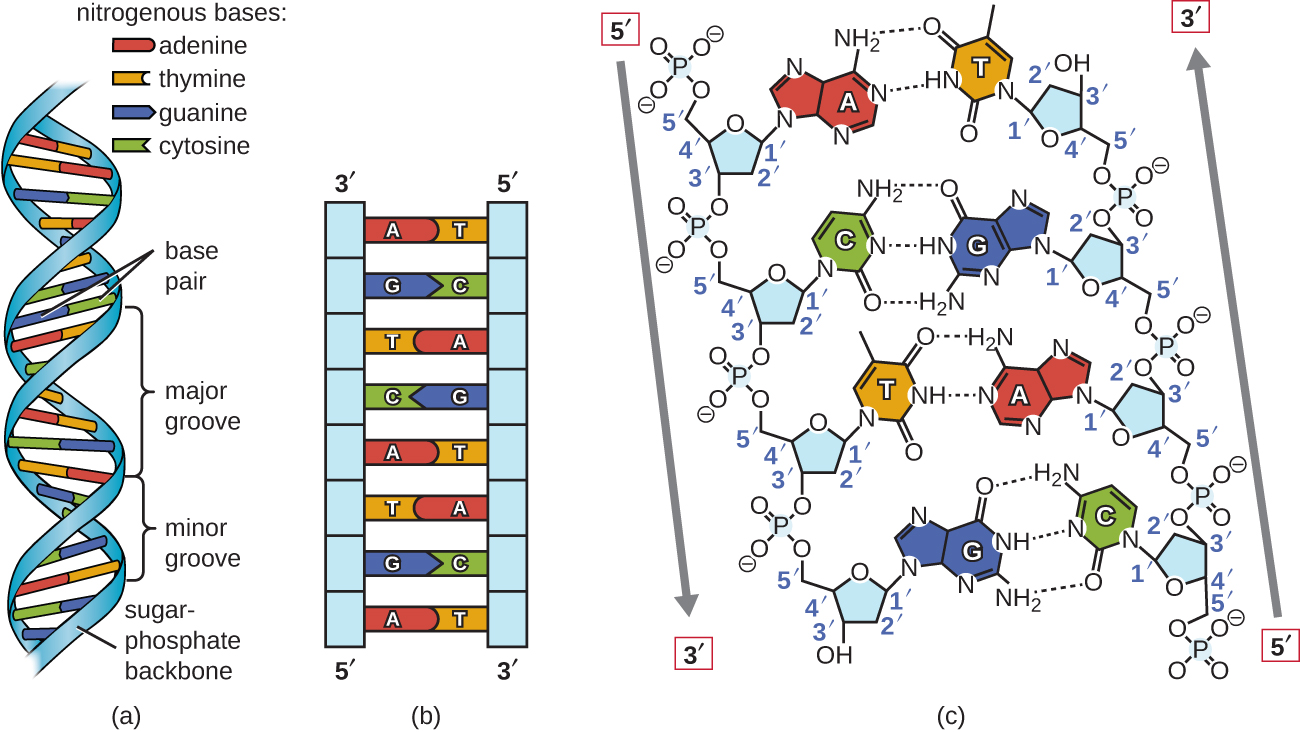
Base pairing takes place between a purine and pyrimidine. In DNA, adenine (A) and thymine (T) are complementary base pairs , and cytosine (C) and guanine (G) are also complementary base pairs, explaining Chargaff’s rules ( [link] ). The base pairs are stabilized by hydrogen bonds; adenine and thymine form two hydrogen bonds between them, whereas cytosine and guanine form three hydrogen bonds between them.

A diagram of DNA showing a short segment which allows the chemical structures to be seen more clearly. The strands show that the phosphate group is always between carbon 3 of one nucleotide and carbon 5 of the next. The two strands are connected with dotted lines indicating hydrogen bonds. The A-T bond has 2 hydrogen bonds and C-G has 3 hydrogen bonds. The negative charge of the phosphates is also apparent.
Hydrogen bonds form between complementary nitrogenous bases on the interior of DNA.

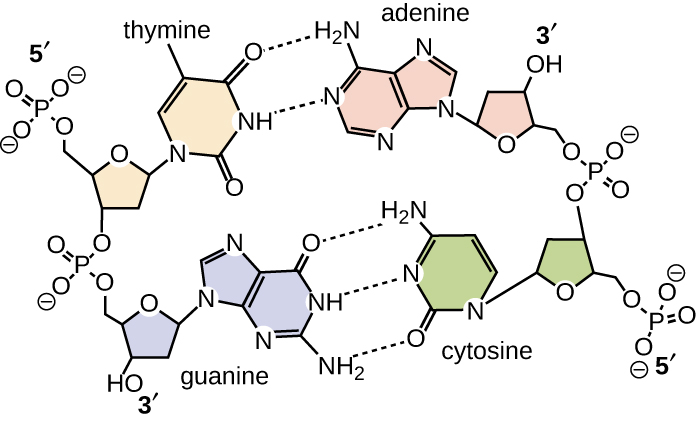
In the laboratory, exposing the two DNA strands of the double helix to high temperatures or to certain chemicals can break the hydrogen bonds between complementary bases, thus separating the strands into two separate single strands of DNA (single-stranded DNA [ ssDNA ]). This process is called DNA denaturation and is analogous to protein denaturation, as described in Proteins . The ssDNA strands can also be put back together as double-stranded DNA ( dsDNA ), through reannealing or renaturing by cooling or removing the chemical denaturants, allowing these hydrogen bonds to reform. The ability to artificially manipulate DNA in this way is the basis for several important techniques in biotechnology ( [link] ). Because of the additional hydrogen bonding between the C = G base pair, DNA with a high GC content is more difficult to denature than DNA with a lower GC content.

Questions & Answers

differentiate between demand and supply giving examples
Lambiv Reply
differentiated between demand and supply using examples
Lambiv
what is labour ?
Lambiv
how will I do?
Venny Reply
how is the graph works?I don't fully understand
Rezat Reply
information
Eliyee
devaluation
Eliyee
t
WARKISA
hi guys good evening to all
Lambiv
multiple choice question
Aster Reply
appreciation
Eliyee
explain perfect market
Lindiwe Reply
In economics, a perfect market refers to a theoretical construct where all participants have perfect information, goods are homogenous, there are no barriers to entry or exit, and prices are determined solely by supply and demand. It's an idealized model used for analysis,
Ezea
What is ceteris paribus?
Shukri Reply
other things being equal
AI-Robot
When MP₁ becomes negative, TP start to decline. Extuples Suppose that the short-run production function of certain cut-flower firm is given by: Q=4KL-0.6K2 - 0.112 • Where is quantity of cut flower produced, I is labour input and K is fixed capital input (K-5). Determine the average product of lab
Kelo
Extuples Suppose that the short-run production function of certain cut-flower firm is given by: Q=4KL-0.6K2 - 0.112 • Where is quantity of cut flower produced, I is labour input and K is fixed capital input (K-5). Determine the average product of labour (APL) and marginal product of labour (MPL)
Kelo
yes,thank you
Shukri
Can I ask you other question?
Shukri
what is monopoly mean?
Habtamu Reply
What is different between quantity demand and demand?
Shukri Reply
Quantity demanded refers to the specific amount of a good or service that consumers are willing and able to purchase at a give price and within a specific time period. Demand, on the other hand, is a broader concept that encompasses the entire relationship between price and quantity demanded
Ezea
ok
Shukri
how do you save a country economic situation when it's falling apart
Lilia Reply
what is the difference between economic growth and development
Fiker Reply
Economic growth as an increase in the production and consumption of goods and services within an economy.but Economic development as a broader concept that encompasses not only economic growth but also social & human well being.
Shukri
production function means
Jabir
What do you think is more important to focus on when considering inequality ?
Abdisa Reply
any question about economics?
Awais Reply
sir...I just want to ask one question... Define the term contract curve? if you are free please help me to find this answer 🙏
Asui
it is a curve that we get after connecting the pareto optimal combinations of two consumers after their mutually beneficial trade offs
Awais
thank you so much 👍 sir
Asui
In economics, the contract curve refers to the set of points in an Edgeworth box diagram where both parties involved in a trade cannot be made better off without making one of them worse off. It represents the Pareto efficient allocations of goods between two individuals or entities, where neither p
Cornelius
In economics, the contract curve refers to the set of points in an Edgeworth box diagram where both parties involved in a trade cannot be made better off without making one of them worse off. It represents the Pareto efficient allocations of goods between two individuals or entities,
Cornelius
Suppose a consumer consuming two commodities X and Y has The following utility function u=X0.4 Y0.6. If the price of the X and Y are 2 and 3 respectively and income Constraint is birr 50. A,Calculate quantities of x and y which maximize utility. B,Calculate value of Lagrange multiplier. C,Calculate quantities of X and Y consumed with a given price. D,alculate optimum level of output .
Feyisa Reply
Answer
Feyisa
c
Jabir
the market for lemon has 10 potential consumers, each having an individual demand curve p=101-10Qi, where p is price in dollar's per cup and Qi is the number of cups demanded per week by the i th consumer.Find the market demand curve using algebra. Draw an individual demand curve and the market dema
Gsbwnw Reply
suppose the production function is given by ( L, K)=L¼K¾.assuming capital is fixed find APL and MPL. consider the following short run production function:Q=6L²-0.4L³ a) find the value of L that maximizes output b)find the value of L that maximizes marginal product
Abdureman
types of unemployment
Yomi Reply
What is the difference between perfect competition and monopolistic competition?
Mohammed
Got questions? Join the online conversation and get instant answers!
Jobilize.com Reply

Get Jobilize Job Search Mobile App in your pocket Now!

Get it on Google Play Download on the App Store Now


Source:  OpenStax, Microbiology. OpenStax CNX. Nov 01, 2016 Download for free at http://cnx.org/content/col12087/1.4
Google Play and the Google Play logo are trademarks of Google Inc.

Notification Switch

Would you like to follow the 'Microbiology' conversation and receive update notifications?

Ask