

| << Chapter < Page | Chapter >> Page > |
But improvements in productive efficiency take time to discover and implement, and economic growth happens only gradually. So, a society must choose between tradeoffs in the present. For government, this process often involves trying to identify where additional spending could do the most good and where reductions in spending would do the least harm. At the individual and firm level, the market economy coordinates a process in which firms seek to produce goods and services in the quantity, quality, and price that people want. But for both the government and the market economy in the short term, increases in production of one good typically mean offsetting decreases somewhere else in the economy.
While every society must choose how much of each good it should produce, it does not need to produce every single good it consumes. Often how much of a good a country decides to produce depends on how expensive it is to produce it versus buying it from a different country. As we saw earlier, the curvature of a country’s PPF gives us information about the tradeoff between devoting resources to producing one good versus another. In particular, its slope gives the opportunity cost of producing one more unit of the good in the x-axis in terms of the other good (in the y-axis). Countries tend to have different opportunity costs of producing a specific good, either because of different climates, geography, technology or skills.
Suppose two countries, the US and Brazil, need to decide how much they will produce of two crops: sugar cane and wheat. Due to its climatic conditions, Brazil can produce a lot of sugar cane per acre but not much wheat. Conversely, the U.S. can produce a lot of wheat per acre, but not much sugar cane. Clearly, Brazil has a lower opportunity cost of producing sugar cane (in terms of wheat) than the U.S. The reverse is also true; the U.S. has a lower opportunity cost of producing wheat than Brazil. This can be illustrated by the PPFs of the two countries in [link]
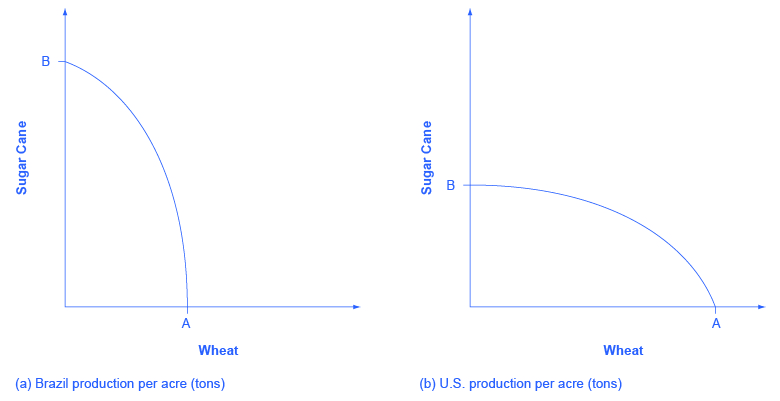
When a country can produce a good at a lower opportunity cost than another country, we say that this country has a comparative advantage in that good. In our example, Brazil has a comparative advantage in sugar cane and the U.S. has a comparative advantage in wheat. One can easily see this with a simple observation of the extreme production points in the PPFs of the two countries. If Brazil devoted all of its resources to producing wheat, it would be producing at point A. If however it had devoted all of its resources to producing sugar cane instead, it would be producing a much larger amount, at point B. By moving from point A to point B Brazil would give up a relatively small quantity in wheat production to obtain a large production in sugar cane. The opposite is true for the U.S. If the U.S. moved from point A to B and produced only sugar cane, this would result in a large opportunity cost in terms of foregone wheat production.
The slope of the PPF gives the opportunity cost of producing an additional unit of wheat. While the slope is not constant throughout the PPFs, it is quite apparent that the PPF in Brazil is much steeper than in the U.S., and therefore the opportunity cost of wheat generally higher in Brazil. In the chapter on International Trade you will learn that countries’ differences in comparative advantage determine which goods they will choose to produce and trade. When countries engage in trade, they specialize in the production of the goods that they have comparative advantage in, and trade part of that production for goods they do not have comparative advantage in. With trade, goods are produced where the opportunity cost is lowest, so total production increases, benefiting both trading parties.
A production possibilities frontier defines the set of choices society faces for the combinations of goods and services it can produce given the resources available. The shape of the PPF is typically curved outward, rather than straight. Choices outside the PPF are unattainable and choices inside the PPF are wasteful. Over time, a growing economy will tend to shift the PPF outwards.
The law of diminishing returns holds that as increments of additional resources are devoted to producing something, the marginal increase in output will become smaller and smaller. All choices along a production possibilities frontier display productive efficiency; that is, it is impossible to use society’s resources to produce more of one good without decreasing production of the other good. The specific choice along a production possibilities frontier that reflects the mix of goods society prefers is the choice with allocative efficiency. The curvature of the PPF is likely to differ by country, which results in different countries having comparative advantage in different goods. Total production can increase if countries specialize in the goods they have comparative advantage in and trade some of their production for the remaining goods.
Notification Switch
Would you like to follow the 'Macroeconomics' conversation and receive update notifications?

|
|
|
|
|

|
|

|
|

|
|

|
|

|
|

|
|

|
|

|
|

|
|

|