

| << Chapter < Page | Chapter >> Page > |
The next Clear It Up feature focuses on the difference between shifts of supply or demand and movements along a curve.
One common mistake in applying the demand and supply framework is to confuse the shift of a demand or a supply curve with movement along a demand or supply curve. As an example, consider a problem that asks whether a drought will increase or decrease the equilibrium quantity and equilibrium price of wheat. Lee, a student in an introductory economics class, might reason:
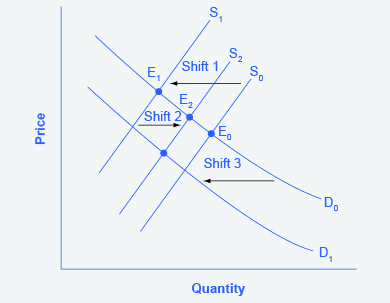
“Well, it is clear that a drought reduces supply, so I will shift back the supply curve, as in the shift from the original supply curve S 0 to S 1 shown on the diagram (called Shift 1). So the equilibrium moves from E 0 to E 1 , the equilibrium quantity is lower and the equilibrium price is higher. Then, a higher price makes farmers more likely to supply the good, so the supply curve shifts right, as shown by the shift from S 1 to S 2 , on the diagram (shown as Shift 2), so that the equilibrium now moves from E 1 to E 2 . The higher price, however, also reduces demand and so causes demand to shift back, like the shift from the original demand curve, D 0 to D 1 on the diagram (labeled Shift 3), and the equilibrium moves from E 2 to E 3 .”
At about this point, Lee suspects that this answer is headed down the wrong path. Think about what might be wrong with Lee’s logic, and then read the answer that follows.
Answer: Lee’s first step is correct: that is, a drought shifts back the supply curve of wheat and leads to a prediction of a lower equilibrium quantity and a higher equilibrium price. This corresponds to a movement along the original demand curve (D 0 ), from E 0 to E 1 . The rest of Lee’s argument is wrong, because it mixes up shifts in supply with quantity supplied, and shifts in demand with quantity demanded. A higher or lower price never shifts the supply curve, as suggested by the shift in supply from S 1 to S 2 . Instead, a price change leads to a movement along a given supply curve. Similarly, a higher or lower price never shifts a demand curve, as suggested in the shift from D 0 to D 1 . Instead, a price change leads to a movement along a given demand curve. Remember, a change in the price of a good never causes the demand or supply curve for that good to shift.
Think carefully about the timeline of events: What happens first, what happens next? What is cause, what is effect? If you keep the order right, you are more likely to get the analysis correct.
In the four-step analysis of how economic events affect equilibrium price and quantity, the movement from the old to the new equilibrium seems immediate. As a practical matter, however, prices and quantities often do not zoom straight to equilibrium. More realistically, when an economic event causes demand or supply to shift, prices and quantities set off in the general direction of equilibrium. Indeed, even as they are moving toward one new equilibrium, prices are often then pushed by another change in demand or supply toward another equilibrium.
When using the supply and demand framework to think about how an event will affect the equilibrium price and quantity, proceed through four steps: (1) sketch a supply and demand diagram to think about what the market looked like before the event; (2) decide whether the event will affect supply or demand; (3) decide whether the effect on supply or demand is negative or positive, and draw the appropriate shifted supply or demand curve; (4) compare the new equilibrium price and quantity to the original ones.
Demand and supply in the market for cheddar cheese is illustrated in [link] . Graph the data and find the equilibrium. Next, create a table showing the change in quantity demanded or quantity supplied, and a graph of the new equilibrium, in each of the following situations:
| Price per Pound | Qd | Qs |
|---|---|---|
| $3.00 | 750 | 540 |
| $3.20 | 700 | 600 |
| $3.40 | 650 | 650 |
| $3.60 | 620 | 700 |
| $3.80 | 600 | 720 |
| $4.00 | 590 | 730 |
Supply and demand for movie tickets in a city are shown in [link] . Graph demand and supply and identify the equilibrium. Then calculate in a table and graph the effect of the following two changes.
| Price per Pound | Qd | Qs |
|---|---|---|
| $5.00 | 26 | 16 |
| $6.00 | 24 | 18 |
| $7.00 | 22 | 20 |
| $8.00 | 21 | 21 |
| $9.00 | 20 | 22 |
Pew Research Center. “Pew Research: Center for the People&the Press.” http://www.people-press.org/.
Notification Switch
Would you like to follow the 'Macroeconomics' conversation and receive update notifications?

|
|

|
|

|
|

|
|

|
|

|
|

|
|

|
|

|
|

|
|

|