<< Chapter < Page Chapter >> Page >

By the end of this section, you will be able to:

  • Explain price controls, price ceilings, and price floors
  • Analyze demand and supply as a social adjustment mechanism

Controversy sometimes surrounds the prices and quantities established by demand and supply, especially for products that are considered necessities. In some cases, discontent over prices turns into public pressure on politicians, who may then pass legislation to prevent a certain price from climbing “too high” or falling “too low.”

The demand and supply model shows how people and firms will react to the incentives provided by these laws to control prices, in ways that will often lead to undesirable consequences. Alternative policy tools can often achieve the desired goals of price control laws, while avoiding at least some of their costs and tradeoffs.

Price ceilings

Laws that government enacts to regulate prices are called Price controls . Price controls come in two flavors. A price ceiling    keeps a price from rising above a certain level (the “ceiling”), while a price floor    keeps a price from falling below a certain level (the “floor”). This section uses the demand and supply framework to analyze price ceilings. The next section discusses price floors.

In many markets for goods and services, demanders outnumber suppliers. Consumers, who are also potential voters, sometimes unite behind a political proposal to hold down a certain price. In some cities, such as Albany, renters have pressed political leaders to pass rent control laws, a price ceiling that usually works by stating that rents can be raised by only a certain maximum percentage each year.

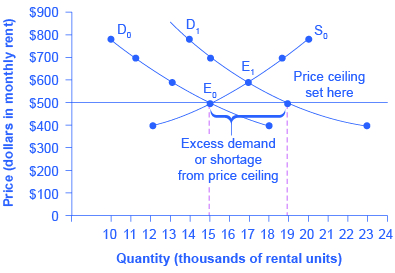
Rent control becomes a politically hot topic when rents begin to rise rapidly. Everyone needs an affordable place to live. Perhaps a change in tastes makes a certain suburb or town a more popular place to live. Perhaps locally-based businesses expand, bringing higher incomes and more people into the area. Changes of this sort can cause a change in the demand for rental housing, as [link] illustrates. The original equilibrium (E 0 ) lies at the intersection of supply curve S 0 and demand curve D 0 , corresponding to an equilibrium price of $500 and an equilibrium quantity of 15,000 units of rental housing. The effect of greater income or a change in tastes is to shift the demand curve for rental housing to the right, as shown by the data in [link] and the shift from D 0 to D 1 on the graph. In this market, at the new equilibrium E 1 , the price of a rental unit would rise to $600 and the equilibrium quantity would increase to 17,000 units.

A price ceiling example—rent control

The graph shows a shift in demand with a price ceiling.
The original intersection of demand and supply occurs at E 0 . If demand shifts from D 0 to D 1 , the new equilibrium would be at E 1 —unless a price ceiling prevents the price from rising. If the price is not permitted to rise, the quantity supplied remains at 15,000. However, after the change in demand, the quantity demanded rises to 19,000, resulting in a shortage.
Rent control
Price Original Quantity Supplied Original Quantity Demanded New Quantity Demanded
$400 12,000 18,000 23,000
$500 15,000 15,000 19,000
$600 17,000 13,000 17,000
$700 19,000 11,000 15,000
$800 20,000 10,000 14,000

Questions & Answers

Ayele, K., 2003. Introductory Economics, 3rd ed., Addis Ababa.
Widad Reply
can you send the book attached ?
Ariel
?
Ariel
What is economics
Widad Reply
the study of how humans make choices under conditions of scarcity
AI-Robot
U(x,y) = (x×y)1/2 find mu of x for y
Desalegn Reply
U(x,y) = (x×y)1/2 find mu of x for y
Desalegn
what is ecnomics
Jan Reply
this is the study of how the society manages it's scarce resources
Belonwu
what is macroeconomic
John Reply
macroeconomic is the branch of economics which studies actions, scale, activities and behaviour of the aggregate economy as a whole.
husaini
etc
husaini
difference between firm and industry
husaini Reply
what's the difference between a firm and an industry
Abdul
firm is the unit which transform inputs to output where as industry contain combination of firms with similar production 😅😅
Abdulraufu
Suppose the demand function that a firm faces shifted from Qd  120 3P to Qd  90  3P and the supply function has shifted from QS  20  2P to QS 10  2P . a) Find the effect of this change on price and quantity. b) Which of the changes in demand and supply is higher?
Toofiq Reply
explain standard reason why economic is a science
innocent Reply
factors influencing supply
Petrus Reply
what is economic.
Milan Reply
scares means__________________ends resources. unlimited
Jan
economics is a science that studies human behaviour as a relationship b/w ends and scares means which have alternative uses
Jan
calculate the profit maximizing for demand and supply
Zarshad Reply
Why qualify 28 supplies
Milan
what are explicit costs
Nomsa Reply
out-of-pocket costs for a firm, for example, payments for wages and salaries, rent, or materials
AI-Robot
concepts of supply in microeconomics
David Reply
economic overview notes
Amahle Reply
identify a demand and a supply curve
Salome Reply
i don't know
Parul
there's a difference
Aryan
Demand curve shows that how supply and others conditions affect on demand of a particular thing and what percent demand increase whith increase of supply of goods
Israr
Hi Sir please how do u calculate Cross elastic demand and income elastic demand?
Abari
Got questions? Join the online conversation and get instant answers!
Jobilize.com Reply

Get Jobilize Job Search Mobile App in your pocket Now!

Get it on Google Play Download on the App Store Now


Source:  OpenStax, Macroeconomics. OpenStax CNX. Jun 16, 2014 Download for free at http://legacy.cnx.org/content/col11626/1.10
Google Play and the Google Play logo are trademarks of Google Inc.

Notification Switch

Would you like to follow the 'Macroeconomics' conversation and receive update notifications?

Ask