<< Chapter < Page Chapter >> Page >
A map of the Oregon territory during the period of joint occupation by the United States and Great Britain shows the area whose ownership was contested by the two powers. The uppermost region is labeled “Rupert’s Land (British),” which lies in between the “54° 40′- Extreme U.S. Claim” and “49°” lines. The central region, which lies in between the “49°” and “42° - Extreme British Claim” lines, contains Oregon Country. Beneath the “42° - Extreme British Claim” line lies Mexico.
This map of the Oregon territory during the period of joint occupation by the United States and Great Britain shows the area whose ownership was contested by the two powers.

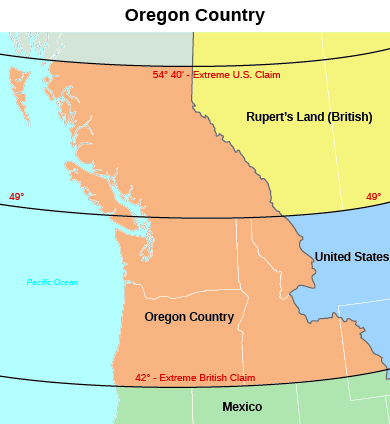
In contrast to the diplomatic solution with Great Britain over Oregon, when it came to Mexico, Polk and the American people proved willing to use force to wrest more land for the United States. In keeping with voters’ expectations, President Polk set his sights on the Mexican state of California. After the mistaken capture of Monterey, negotiations about purchasing the port of San Francisco from Mexico broke off until September 1845. Then, following a revolt in California that left it divided in two, Polk attempted to purchase Upper California and New Mexico as well. These efforts went nowhere. The Mexican government, angered by U.S. actions, refused to recognize the independence of Texas.

Finally, after nearly a decade of public clamoring for the annexation of Texas, in December 1845 Polk officially agreed to the annexation of the former Mexican state, making the Lone Star Republic an additional slave state. Incensed that the United States had annexed Texas, however, the Mexican government refused to discuss the matter of selling land to the United States. Indeed, Mexico refused even to acknowledge Polk’s emissary, John Slidell, who had been sent to Mexico City to negotiate. Not to be deterred, Polk encouraged Thomas O. Larkin, the U.S. consul in Monterey, to assist any American settlers and any Californios    , the Mexican residents of the state, who wished to proclaim their independence from Mexico. By the end of 1845, having broken diplomatic ties with the United States over Texas and having grown alarmed by American actions in California, the Mexican government warily anticipated the next move. It did not have long to wait.

War with mexico, 1846–1848

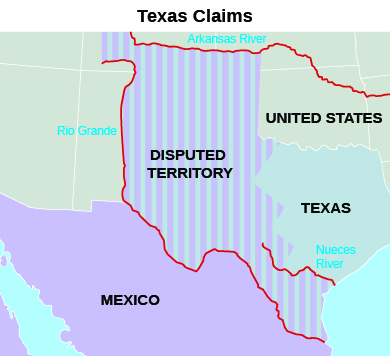
Expansionistic fervor propelled the United States to war against Mexico in 1846. The United States had long argued that the Rio Grande was the border between Mexico and the United States, and at the end of the Texas war for independence Santa Anna had been pressured to agree. Mexico, however, refused to be bound by Santa Anna’s promises and insisted the border lay farther north, at the Nueces River ( [link] ). To set it at the Rio Grande would, in effect, allow the United States to control land it had never occupied. In Mexico’s eyes, therefore, President Polk violated its sovereign territory when he ordered U.S. troops into the disputed lands in 1846. From the Mexican perspective, it appeared the United States had invaded their nation.

A map titled “Texas Claims” indicates the borders of Mexico, Texas, the United States, and “Disputed Territory,” as well as the Rio Grande, the Arkansas River, and the Nueces River.
In 1845, when Texas joined the United States, Mexico insisted the United States had a right only to the territory northeast of the Nueces River. The United States argued in turn that it should have title to all land between the Nueces and the Rio Grande as well.

In January 1846, the U.S. force that was ordered to the banks of the Rio Grande to build a fort on the “American” side encountered a Mexican cavalry unit on patrol. Shots rang out, and sixteen U.S. soldiers were killed or wounded. Angrily declaring that Mexico “has invaded our territory and shed American blood upon American soil,” President Polk demanded the United States declare war on Mexico. On May 12, Congress obliged.

Questions & Answers

how do you get the 2/50
Abba Reply
number of sport play by 50 student construct discrete data
Aminu Reply
width of the frangebany leaves on how to write a introduction
Theresa Reply
Solve the mean of variance
Veronica Reply
Step 1: Find the mean. To find the mean, add up all the scores, then divide them by the number of scores. ... Step 2: Find each score's deviation from the mean. ... Step 3: Square each deviation from the mean. ... Step 4: Find the sum of squares. ... Step 5: Divide the sum of squares by n – 1 or N.
kenneth
what is error
Yakuba Reply
Is mistake done to something
Vutshila
Hy
anas
hy
What is the life teble
anas
hy
Jibrin
statistics is the analyzing of data
Tajudeen Reply
what is statics?
Zelalem Reply
how do you calculate mean
Gloria Reply
diveving the sum if all values
Shaynaynay
let A1,A2 and A3 events be independent,show that (A1)^c, (A2)^c and (A3)^c are independent?
Fisaye Reply
what is statistics
Akhisani Reply
data collected all over the world
Shaynaynay
construct a less than and more than table
Imad Reply
The sample of 16 students is taken. The average age in the sample was 22 years with astandard deviation of 6 years. Construct a 95% confidence interval for the age of the population.
Aschalew Reply
Bhartdarshan' is an internet-based travel agency wherein customer can see videos of the cities they plant to visit. The number of hits daily is a normally distributed random variable with a mean of 10,000 and a standard deviation of 2,400 a. what is the probability of getting more than 12,000 hits? b. what is the probability of getting fewer than 9,000 hits?
Akshay Reply
Bhartdarshan'is an internet-based travel agency wherein customer can see videos of the cities they plan to visit. The number of hits daily is a normally distributed random variable with a mean of 10,000 and a standard deviation of 2,400. a. What is the probability of getting more than 12,000 hits
Akshay
1
Bright
Sorry i want to learn more about this question
Bright
Someone help
Bright
a= 0.20233 b=0.3384
Sufiyan
a
Shaynaynay
How do I interpret level of significance?
Mohd Reply
It depends on your business problem or in Machine Learning you could use ROC- AUC cruve to decide the threshold value
Shivam
how skewness and kurtosis are used in statistics
Owen Reply
yes what is it
Taneeya
Got questions? Join the online conversation and get instant answers!
Jobilize.com Reply

Get Jobilize Job Search Mobile App in your pocket Now!

Get it on Google Play Download on the App Store Now


Source:  OpenStax, U.s. history. OpenStax CNX. Jan 12, 2015 Download for free at http://legacy.cnx.org/content/col11740/1.3
Google Play and the Google Play logo are trademarks of Google Inc.

Notification Switch

Would you like to follow the 'U.s. history' conversation and receive update notifications?

Ask