<< Chapter < Page Chapter >> Page >
A photograph shows the Home Insurance Building in Chicago.
While the technology existed to engineer tall buildings, it was not until the invention of the electric elevator in 1889 that skyscrapers began to take over the urban landscape. Shown here is the Home Insurance Building in Chicago, considered the first modern skyscraper.

Jacob riis and the window into “how the other half lives”

Jacob Riis was a Danish immigrant who moved to New York in the late nineteenth century and, after experiencing poverty and joblessness first-hand, ultimately built a career as a police reporter. In the course of his work, he spent much of his time in the slums and tenements of New York’s working poor. Appalled by what he found there, Riis began documenting these scenes of squalor and sharing them through lectures and ultimately through the publication of his book, How the Other Half Lives , in 1890 ( [link] ).

A photograph shows an alley between two tenements. Men, women, and children stand on either side of the alley, in the stoops, and in the windows.
In photographs such as Bandit’s Roost (1888), taken on Mulberry Street in the infamous Five Points neighborhood of Manhattan’s Lower East Side, Jacob Riis documented the plight of New York City slums in the late nineteenth century.

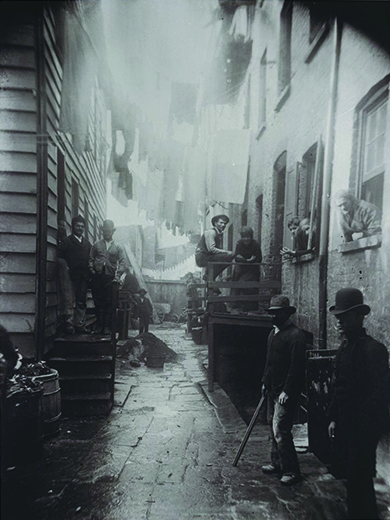
By most contemporary accounts, Riis was an effective storyteller, using drama and racial stereotypes to tell his stories of the ethnic slums he encountered. But while his racial thinking was very much a product of his time, he was also a reformer; he felt strongly that upper and middle-class Americans could and should care about the living conditions of the poor. In his book and lectures, he argued against the immoral landlords and useless laws that allowed dangerous living conditions and high rents. He also suggested remodeling existing tenements or building new ones. He was not alone in his concern for the plight of the poor; other reporters and activists had already brought the issue into the public eye, and Riis’s photographs added a new element to the story.

To tell his stories, Riis used a series of deeply compelling photographs. Riis and his group of amateur photographers moved through the various slums of New York, laboriously setting up their tripods and explosive chemicals to create enough light to take the photographs. His photos and writings shocked the public, made Riis a well-known figure both in his day and beyond, and eventually led to new state legislation curbing abuses in tenements.

The immediate challenges of urban life

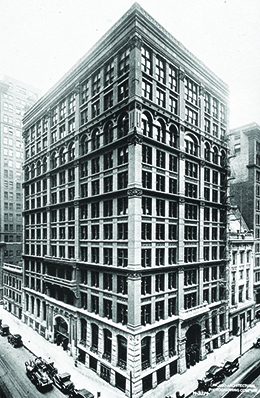
Congestion, pollution, crime, and disease were prevalent problems in all urban centers; city planners and inhabitants alike sought new solutions to the problems caused by rapid urban growth. Living conditions for most working-class urban dwellers were atrocious. They lived in crowded tenement houses and cramped apartments with terrible ventilation and substandard plumbing and sanitation. As a result, disease ran rampant, with typhoid and cholera common. Memphis, Tennessee, experienced waves of cholera (1873) followed by yellow fever (1878 and 1879) that resulted in the loss of over ten thousand lives. By the late 1880s, New York City, Baltimore, Chicago, and New Orleans had all introduced sewage pumping systems to provide efficient waste management. Many cities were also serious fire hazards. An average working-class family of six, with two adults and four children, had at best a two-bedroom tenement. By one 1900 estimate, in the New York City borough of Manhattan alone, there were nearly fifty thousand tenement houses. The photographs of these tenement houses are seen in Jacob Riis’s book, How the Other Half Lives , discussed in the feature above. Citing a study by the New York State Assembly at this time, Riis found New York to be the most densely populated city in the world, with as many as eight hundred residents per square acre in the Lower East Side working-class slums, comprising the Eleventh and Thirteenth Wards.

Questions & Answers

how do you get the 2/50
Abba Reply
number of sport play by 50 student construct discrete data
Aminu Reply
width of the frangebany leaves on how to write a introduction
Theresa Reply
Solve the mean of variance
Veronica Reply
Step 1: Find the mean. To find the mean, add up all the scores, then divide them by the number of scores. ... Step 2: Find each score's deviation from the mean. ... Step 3: Square each deviation from the mean. ... Step 4: Find the sum of squares. ... Step 5: Divide the sum of squares by n – 1 or N.
kenneth
what is error
Yakuba Reply
Is mistake done to something
Vutshila
Hy
anas
hy
What is the life teble
anas
hy
Jibrin
statistics is the analyzing of data
Tajudeen Reply
what is statics?
Zelalem Reply
how do you calculate mean
Gloria Reply
diveving the sum if all values
Shaynaynay
let A1,A2 and A3 events be independent,show that (A1)^c, (A2)^c and (A3)^c are independent?
Fisaye Reply
what is statistics
Akhisani Reply
data collected all over the world
Shaynaynay
construct a less than and more than table
Imad Reply
The sample of 16 students is taken. The average age in the sample was 22 years with astandard deviation of 6 years. Construct a 95% confidence interval for the age of the population.
Aschalew Reply
Bhartdarshan' is an internet-based travel agency wherein customer can see videos of the cities they plant to visit. The number of hits daily is a normally distributed random variable with a mean of 10,000 and a standard deviation of 2,400 a. what is the probability of getting more than 12,000 hits? b. what is the probability of getting fewer than 9,000 hits?
Akshay Reply
Bhartdarshan'is an internet-based travel agency wherein customer can see videos of the cities they plan to visit. The number of hits daily is a normally distributed random variable with a mean of 10,000 and a standard deviation of 2,400. a. What is the probability of getting more than 12,000 hits
Akshay
1
Bright
Sorry i want to learn more about this question
Bright
Someone help
Bright
a= 0.20233 b=0.3384
Sufiyan
a
Shaynaynay
How do I interpret level of significance?
Mohd Reply
It depends on your business problem or in Machine Learning you could use ROC- AUC cruve to decide the threshold value
Shivam
how skewness and kurtosis are used in statistics
Owen Reply
yes what is it
Taneeya
Got questions? Join the online conversation and get instant answers!
Jobilize.com Reply

Get Jobilize Job Search Mobile App in your pocket Now!

Get it on Google Play Download on the App Store Now


Source:  OpenStax, U.s. history. OpenStax CNX. Jan 12, 2015 Download for free at http://legacy.cnx.org/content/col11740/1.3
Google Play and the Google Play logo are trademarks of Google Inc.

Notification Switch

Would you like to follow the 'U.s. history' conversation and receive update notifications?

Ask