<< Chapter < Page
  U.s. history   Page 1 / 1
Chapter >> Page >
  • Early Industrialization in the Northeast
  • A Vibrant Capitalist Republic
  • On the Move: The Transportation Revolution
  • A New Social Order: Class Divisions
A painting depicts a busy street in the Five Points neighborhood. People of all ages, ethnicities, and social classes swarm in various directions, with buildings and shops in the background.
Five Points (1827), by George Catlin, depicts the infamous Five Points neighborhood of New York City, so called because it was centered at the intersection of five streets. Five Points was home to a polyglot mix of recent immigrants, freed slaves, and other members of the working class.

By the 1830s, the United States had developed a thriving industrial and commercial sector in the Northeast. Farmers embraced regional and distant markets as the primary destination for their products. Artisans witnessed the methodical division of the labor process in factories. Wage labor became an increasingly common experience. These industrial and market revolutions, combined with advances in transportation, transformed the economic and social landscape. Americans could now quickly produce larger amounts of goods for a nationwide, and sometimes an international, market and rely less on foreign imports than in colonial times.

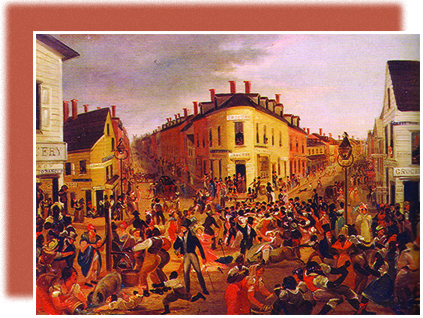
As American economic life shifted rapidly and modes of production changed, new class divisions emerged and solidified, resulting in previously unknown economic and social inequalities. This image of the Five Points district in New York City captures the turbulence of the time ( [link] ). Five Points began as a settlement for freed slaves, but it soon became a crowded urban world of American day laborers and low-wage workers who lived a precarious existence that the economic benefits of the new economy largely bypassed. An influx of immigrant workers swelled and diversified an already crowded urban population. By the 1830s, the area had become a slum, home to widespread poverty, crime, and disease. Advances in industrialization and the market revolution came at a human price.

Questions & Answers

how do you get the 2/50
Abba Reply
number of sport play by 50 student construct discrete data
Aminu Reply
width of the frangebany leaves on how to write a introduction
Theresa Reply
Solve the mean of variance
Veronica Reply
Step 1: Find the mean. To find the mean, add up all the scores, then divide them by the number of scores. ... Step 2: Find each score's deviation from the mean. ... Step 3: Square each deviation from the mean. ... Step 4: Find the sum of squares. ... Step 5: Divide the sum of squares by n – 1 or N.
kenneth
what is error
Yakuba Reply
Is mistake done to something
Vutshila
Hy
anas
hy
What is the life teble
anas
hy
Jibrin
statistics is the analyzing of data
Tajudeen Reply
what is statics?
Zelalem Reply
how do you calculate mean
Gloria Reply
diveving the sum if all values
Shaynaynay
let A1,A2 and A3 events be independent,show that (A1)^c, (A2)^c and (A3)^c are independent?
Fisaye Reply
what is statistics
Akhisani Reply
data collected all over the world
Shaynaynay
construct a less than and more than table
Imad Reply
The sample of 16 students is taken. The average age in the sample was 22 years with astandard deviation of 6 years. Construct a 95% confidence interval for the age of the population.
Aschalew Reply
Bhartdarshan' is an internet-based travel agency wherein customer can see videos of the cities they plant to visit. The number of hits daily is a normally distributed random variable with a mean of 10,000 and a standard deviation of 2,400 a. what is the probability of getting more than 12,000 hits? b. what is the probability of getting fewer than 9,000 hits?
Akshay Reply
Bhartdarshan'is an internet-based travel agency wherein customer can see videos of the cities they plan to visit. The number of hits daily is a normally distributed random variable with a mean of 10,000 and a standard deviation of 2,400. a. What is the probability of getting more than 12,000 hits
Akshay
1
Bright
Sorry i want to learn more about this question
Bright
Someone help
Bright
a= 0.20233 b=0.3384
Sufiyan
a
Shaynaynay
How do I interpret level of significance?
Mohd Reply
It depends on your business problem or in Machine Learning you could use ROC- AUC cruve to decide the threshold value
Shivam
how skewness and kurtosis are used in statistics
Owen Reply
yes what is it
Taneeya
Got questions? Join the online conversation and get instant answers!
Jobilize.com Reply

Get Jobilize Job Search Mobile App in your pocket Now!

Get it on Google Play Download on the App Store Now


Source:  OpenStax, U.s. history. OpenStax CNX. Jan 12, 2015 Download for free at http://legacy.cnx.org/content/col11740/1.3
Google Play and the Google Play logo are trademarks of Google Inc.

Notification Switch

Would you like to follow the 'U.s. history' conversation and receive update notifications?

Ask