<< Chapter < Page Chapter >> Page >

The production possibilities frontier can illustrate two kinds of efficiency: productive efficiency and allocative efficiency. [link] illustrates these ideas using a production possibilities frontier between healthcare and education.

Productive and allocative efficiency

The graph shows that when a greater quantity of one good increases, the quantity of other goods will decrease. Point R on the graph represents the good that drops in quantity as a result of greater efficiency in producing other goods.
Productive efficiency means it is impossible to produce more of one good without decreasing the quantity that is produced of another good. Thus, all choices along a given PPF like B, C, and D display productive efficiency, but R does not. Allocative efficiency means that the particular mix of goods being produced—that is, the specific choice along the production possibilities frontier—represents the allocation that society most desires.

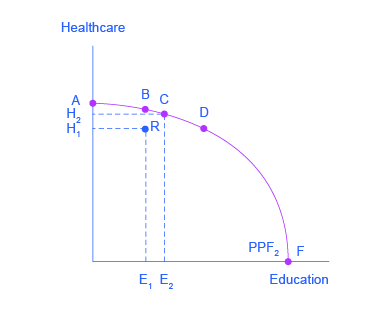
Productive efficiency means that, given the available inputs and technology, it is impossible to produce more of one good without decreasing the quantity that is produced of another good. All choices on the PPF in [link] , including A, B, C, D, and F, display productive efficiency. As a firm moves from any one of these choices to any other, either healthcare increases and education decreases or vice versa. However, any choice inside the production possibilities frontier is productively inefficient and wasteful because it is possible to produce more of one good, the other good, or some combination of both goods.

For example, point R is productively inefficient because it is possible at choice C to have more of both goods: education on the horizontal axis is higher at point C than point R (E 2 is greater than E 1 ), and healthcare on the vertical axis is also higher at point C than point R (H 2 is great than H 1 ).

The particular mix of goods and services being produced—that is, the specific combination of healthcare and education chosen along the production possibilities frontier—can be shown as a ray (line) from the origin to a specific point on the PPF. Output mixes that had more healthcare (and less education) would have a steeper ray, while those with more education (and less healthcare) would have a flatter ray.

Allocative efficiency means that the particular mix of goods a society produces represents the combination that society most desires. How to determine what a society desires can be a controversial question, and is usually discussed in political science, sociology, and philosophy classes as well as in economics. At its most basic, allocative efficiency means producers supply the quantity of each product that consumers demand. Only one of the productively efficient choices will be the allocatively efficient choice for society as a whole.

Why society must choose

Every economy faces two situations in which it may be able to expand consumption of all goods. In the first case, a society may discover that it has been using its resources inefficiently, in which case by improving efficiency and producing on the production possibilities frontier, it can have more of all goods (or at least more of some and less of none). In the second case, as resources grow over a period of years (e.g., more labor and more capital), the economy grows. As it does, the production possibilities frontier for a society will tend to shift outward and society will be able to afford more of all goods.

Questions & Answers

how do you get the 2/50
Abba Reply
number of sport play by 50 student construct discrete data
Aminu Reply
width of the frangebany leaves on how to write a introduction
Theresa Reply
Solve the mean of variance
Veronica Reply
Step 1: Find the mean. To find the mean, add up all the scores, then divide them by the number of scores. ... Step 2: Find each score's deviation from the mean. ... Step 3: Square each deviation from the mean. ... Step 4: Find the sum of squares. ... Step 5: Divide the sum of squares by n – 1 or N.
kenneth
what is error
Yakuba Reply
Is mistake done to something
Vutshila
Hy
anas
hy
What is the life teble
anas
hy
Jibrin
statistics is the analyzing of data
Tajudeen Reply
what is statics?
Zelalem Reply
how do you calculate mean
Gloria Reply
diveving the sum if all values
Shaynaynay
let A1,A2 and A3 events be independent,show that (A1)^c, (A2)^c and (A3)^c are independent?
Fisaye Reply
what is statistics
Akhisani Reply
data collected all over the world
Shaynaynay
construct a less than and more than table
Imad Reply
The sample of 16 students is taken. The average age in the sample was 22 years with astandard deviation of 6 years. Construct a 95% confidence interval for the age of the population.
Aschalew Reply
Bhartdarshan' is an internet-based travel agency wherein customer can see videos of the cities they plant to visit. The number of hits daily is a normally distributed random variable with a mean of 10,000 and a standard deviation of 2,400 a. what is the probability of getting more than 12,000 hits? b. what is the probability of getting fewer than 9,000 hits?
Akshay Reply
Bhartdarshan'is an internet-based travel agency wherein customer can see videos of the cities they plan to visit. The number of hits daily is a normally distributed random variable with a mean of 10,000 and a standard deviation of 2,400. a. What is the probability of getting more than 12,000 hits
Akshay
1
Bright
Sorry i want to learn more about this question
Bright
Someone help
Bright
a= 0.20233 b=0.3384
Sufiyan
a
Shaynaynay
How do I interpret level of significance?
Mohd Reply
It depends on your business problem or in Machine Learning you could use ROC- AUC cruve to decide the threshold value
Shivam
how skewness and kurtosis are used in statistics
Owen Reply
yes what is it
Taneeya
Got questions? Join the online conversation and get instant answers!
Jobilize.com Reply

Get Jobilize Job Search Mobile App in your pocket Now!

Get it on Google Play Download on the App Store Now


Source:  OpenStax, Principles of economics. OpenStax CNX. Sep 19, 2014 Download for free at http://legacy.cnx.org/content/col11613/1.11
Google Play and the Google Play logo are trademarks of Google Inc.

Notification Switch

Would you like to follow the 'Principles of economics' conversation and receive update notifications?

Ask