

| << Chapter < Page | Chapter >> Page > |
Step 1. Draw a demand and supply model to illustrate the market for salmon in the year before the good weather conditions began. The demand curve D 0 and the supply curve S 0 show that the original equilibrium price is $3.25 per pound and the original equilibrium quantity is 250,000 fish. (This price per pound is what commercial buyers pay at the fishing docks; what consumers pay at the grocery is higher.)
Step 2. Did the economic event affect supply or demand? Good weather is an example of a natural condition that affects supply.
Step 3. Was the effect on supply an increase or a decrease? Good weather is a change in natural conditions that increases the quantity supplied at any given price. The supply curve shifts to the right, moving from the original supply curve S 0 to the new supply curve S 1 , which is shown in both the table and the figure.
Step 4. Compare the new equilibrium price and quantity to the original equilibrium. At the new equilibrium E 1 , the equilibrium price falls from $3.25 to $2.50, but the equilibrium quantity increases from 250,000 to 550,000 salmon. Notice that the equilibrium quantity demanded increased, even though the demand curve did not move.
In short, good weather conditions increased supply of the California commercial salmon. The result was a higher equilibrium quantity of salmon bought and sold in the market at a lower price.
According to the Pew Research Center for People and the Press , more and more people, especially younger people, are getting their news from online and digital sources. The majority of U.S. adults now own smartphones or tablets, and most of those Americans say they use them in part to get the news. From 2004 to 2012, the share of Americans who reported getting their news from digital sources increased from 24% to 39%. How has this affected consumption of print news media, and radio and television news? [link] and the text below illustrates using the four-step analysis to answer this question.
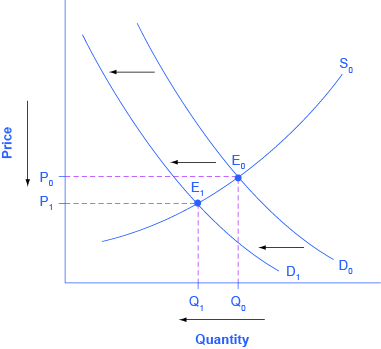
Step 1. Develop a demand and supply model to think about what the market looked like before the event. The demand curve D 0 and the supply curve S 0 show the original relationships. In this case, the analysis is performed without specific numbers on the price and quantity axis.
Step 2. Did the change described affect supply or demand? A change in tastes, from traditional news sources (print, radio, and television) to digital sources, caused a change in demand for the former.
Step 3. Was the effect on demand positive or negative? A shift to digital news sources will tend to mean a lower quantity demanded of traditional news sources at every given price, causing the demand curve for print and other traditional news sources to shift to the left, from D 0 to D 1 .
Step 4. Compare the new equilibrium price and quantity to the original equilibrium price. The new equilibrium (E 1 ) occurs at a lower quantity and a lower price than the original equilibrium (E 0 ).
Notification Switch
Would you like to follow the 'Principles of economics' conversation and receive update notifications?

|
|
|
|
|

|
|

|
|

|
|

|
|
|
|
|

|
|

|
|

|
|
|
|
|

|