<< Chapter < Page Chapter >> Page >

Components of the aggregate production function

Economists construct different production functions depending on the focus of their studies. [link] presents two examples of aggregate production functions. In the first production function, shown in [link] (a), the output is GDP. The inputs in this example are workforce, human capital, physical capital, and technology. We discuss these inputs further in the module, Components of Economic Growth.

Aggregate production functions

The first illustration shows that workforce, human capital, physical capital, and technology produce GDP. The second illustration shows that human capital per person, physical capital per person, and technology per person produce GDP per capital.
An aggregate production function shows what goes into producing the output for an overall economy. (a) This aggregate production function has GDP as its output. (b) This aggregate production function has GDP per capita as its output. Because it is calculated on a per-person basis, the labor input is already figured into the other factors and does not need to be listed separately.

Measuring productivity

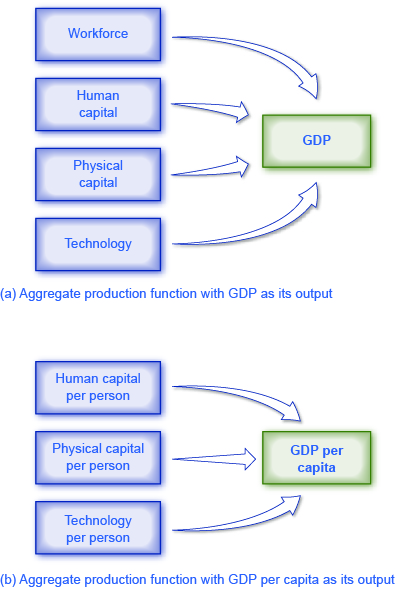
An economy’s rate of productivity growth is closely linked to the growth rate of its GDP per capita, although the two are not identical. For example, if the percentage of the population who holds jobs in an economy increases, GDP per capita will increase but the productivity of individual workers may not be affected. Over the long term, the only way that GDP per capita can grow continually is if the productivity of the average worker rises or if there are complementary increases in capital.

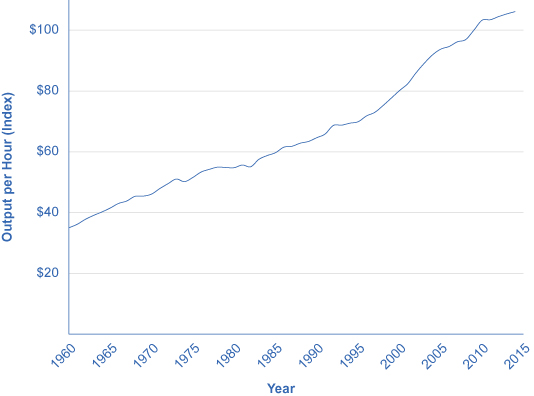
A common measure of U.S. productivity per worker is dollar value per hour the worker contributes to the employer’s output. This measure excludes government workers, because their output is not sold in the market and so their productivity is hard to measure. It also excludes farming, which accounts for only a relatively small share of the U.S. economy. [link] shows an index of output per hour, with 2009 as the base year (when the index equals 100). The index equaled about 106 in 2014. In 1972, the index equaled 50, which shows that workers have more than doubled their productivity since then.

Output per hour worked in the u.s. economy, 1947–2011

The graph shows that output per hour has steadily increased since 1960, when it was $32, to 2014, when it was $106.148.
Output per hour worked is a measure of worker productivity. In the U.S. economy, worker productivity rose more quickly in the 1960s and the mid-1990s compared with the 1970s and 1980s. However, these growth-rate differences are only a few percentage points per year. Look carefully to see them in the changing slope of the line. The average U.S. worker produced over twice as much per hour in 2014 than he did in the early 1970s. (Source: U.S. Department of Labor, Bureau of Labor Statistics.)

According to the Department of Labor, U.S. productivity growth was fairly strong in the 1950s but then declined in the 1970s and 1980s before rising again in the second half of the 1990s and the first half of the 2000s. In fact, the rate of productivity measured by the change in output per hour worked averaged 3.2% per year from 1950 to 1970; dropped to 1.9% per year from 1970 to 1990; and then climbed back to over 2.3% from 1991 to the present, with another modest slowdown after 2001. [link] shows average annual rates of productivity growth averaged over time since 1950.

Questions & Answers

what does mean opportunity cost?
Aster Reply
what is poetive effect of population growth
Solomon Reply
what is inflation
Nasir Reply
what is demand
Eleni
what is economics
IMLAN Reply
economics theory describes individual behavior as the result of a process of optimization under constraints the objective to be reached being determined by
Kalkidan
Economics is a branch of social science that deal with How to wise use of resource ,s
Kassie
need
WARKISA
Economic Needs: In economics, needs are goods or services that are necessary for maintaining a certain standard of living. This includes things like healthcare, education, and transportation.
Kalkidan
What is demand and supply
EMPEROR Reply
deman means?
Alex
what is supply?
Alex
ex play supply?
Alex
Money market is a branch or segment of financial market where short-term debt instruments are traded upon. The instruments in this market includes Treasury bills, Bonds, Commercial Papers, Call money among other.
murana Reply
good
Kayode
what is money market
umar Reply
Examine the distinction between theory of comparative cost Advantage and theory of factor proportion
Fatima Reply
What is inflation
Bright Reply
a general and ongoing rise in the level of prices in an economy
AI-Robot
What are the factors that affect demand for a commodity
Florence Reply
price
Kenu
differentiate between demand and supply giving examples
Lambiv Reply
differentiated between demand and supply using examples
Lambiv
what is labour ?
Lambiv
how will I do?
Venny Reply
how is the graph works?I don't fully understand
Rezat Reply
information
Eliyee
devaluation
Eliyee
t
WARKISA
hi guys good evening to all
Lambiv
multiple choice question
Aster Reply
appreciation
Eliyee
explain perfect market
Lindiwe Reply
In economics, a perfect market refers to a theoretical construct where all participants have perfect information, goods are homogenous, there are no barriers to entry or exit, and prices are determined solely by supply and demand. It's an idealized model used for analysis,
Ezea

Get Jobilize Job Search Mobile App in your pocket Now!

Get it on Google Play Download on the App Store Now


Source:  OpenStax, Principles of economics. OpenStax CNX. Sep 19, 2014 Download for free at http://legacy.cnx.org/content/col11613/1.11
Google Play and the Google Play logo are trademarks of Google Inc.

Notification Switch

Would you like to follow the 'Principles of economics' conversation and receive update notifications?

Ask