

| << Chapter < Page | Chapter >> Page > |
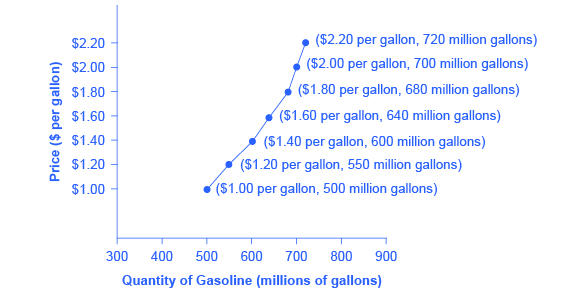
| Price (per gallon) | Quantity Supplied (millions of gallons) |
|---|---|
| $1.00 | 500 |
| $1.20 | 550 |
| $1.40 | 600 |
| $1.60 | 640 |
| $1.80 | 680 |
| $2.00 | 700 |
| $2.20 | 720 |
The shape of supply curves will vary somewhat according to the product: steeper, flatter, straighter, or curved. Nearly all supply curves, however, share a basic similarity: they slope up from left to right and illustrate the law of supply: as the price rises, say, from $1.00 per gallon to $2.20 per gallon, the quantity supplied increases from 500 gallons to 720 gallons. Conversely, as the price falls, the quantity supplied decreases.
Because the graphs for demand and supply curves both have price on the vertical axis and quantity on the horizontal axis, the demand curve and supply curve for a particular good or service can appear on the same graph. Together, demand and supply determine the price and the quantity that will be bought and sold in a market.
[link] illustrates the interaction of demand and supply in the market for gasoline. The demand curve (D) is identical to [link] . The supply curve (S) is identical to [link] . [link] contains the same information in tabular form.
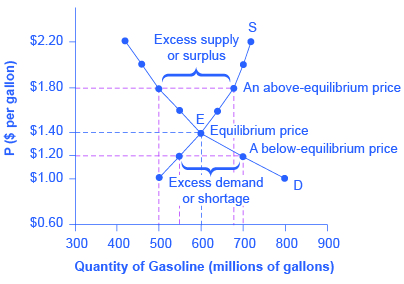
| Price (per gallon) | Quantity demanded (millions of gallons) | Quantity supplied (millions of gallons) |
|---|---|---|
| $1.00 | 800 | 500 |
| $1.20 | 700 | 550 |
| $1.40 | 600 | 600 |
| $1.60 | 550 | 640 |
| $1.80 | 500 | 680 |
| $2.00 | 460 | 700 |
| $2.20 | 420 | 720 |
Remember this: When two lines on a diagram cross, this intersection usually means something. The point where the supply curve (S) and the demand curve (D) cross, designated by point E in [link] , is called the equilibrium . The equilibrium price is the only price where the plans of consumers and the plans of producers agree—that is, where the amount of the product consumers want to buy (quantity demanded) is equal to the amount producers want to sell (quantity supplied). This common quantity is called the equilibrium quantity . At any other price, the quantity demanded does not equal the quantity supplied, so the market is not in equilibrium at that price.
In [link] , the equilibrium price is $1.40 per gallon of gasoline and the equilibrium quantity is 600 million gallons. If you had only the demand and supply schedules, and not the graph, you could find the equilibrium by looking for the price level on the tables where the quantity demanded and the quantity supplied are equal.
Notification Switch
Would you like to follow the 'Principles of economics' conversation and receive update notifications?

|
|
|
|
|

|
|

|
|

|
|

|
|

|
|

|
|

|
|

|
|

|
|

|