<< Chapter < Page Chapter >> Page >

The equilibrium occurs where national income is equal to aggregate expenditure, which is shown on the graph as the point where the aggregate expenditure schedule crosses the 45-degree line. In this example, the equilibrium occurs at 6,000. This equilibrium can also be read off the table under the figure; it is the level of national income where aggregate expenditure is equal to national income.

Equilibrium in the keynesian cross model

With the aggregate expenditure line in place, the next step is to relate it to the two other elements of the Keynesian cross diagram. Thus, the first subsection interprets the intersection of the aggregate expenditure function and the 45-degree line, while the next subsection relates this point of intersection to the potential GDP line.

Where Equilibrium Occurs

The point where the aggregate expenditure line that is constructed from C + I + G + X – M crosses the 45-degree line will be the equilibrium for the economy. It is the only point on the aggregate expenditure line where the total amount being spent on aggregate demand equals the total level of production. In [link] , this point of equilibrium (E 0 ) happens at 6,000, which can also be read off [link] .

The meaning of “equilibrium” remains the same; that is, equilibrium is a point of balance where no incentive exists to shift away from that outcome. To understand why the point of intersection between the aggregate expenditure function and the 45-degree line is a macroeconomic equilibrium, consider what would happen if an economy found itself to the right of the equilibrium point E, say point H in [link] , where output is higher than the equilibrium. At point H, the level of aggregate expenditure is below the 45-degree line, so that the level of aggregate expenditure in the economy is less than the level of output. As a result, at point H, output is piling up unsold—not a sustainable state of affairs.

Equilibrium in the keynesian cross diagram

The graph shows the only point at which there can be equilibrium in the Keynesian cross diagram.
If output was above the equilibrium level, at H, then the real output is greater than the aggregate expenditure in the economy. This pattern cannot hold, because it would mean that goods are produced but piling up unsold. If output was below the equilibrium level at L, then aggregate expenditure would be greater than output. This pattern cannot hold either, because it would mean that spending exceeds the number of goods being produced. Only point E can be at equilibrium, where output, or national income and aggregate expenditure, are equal. The equilibrium (E) must lie on the 45-degree line, which is the set of points where national income and aggregate expenditure are equal.

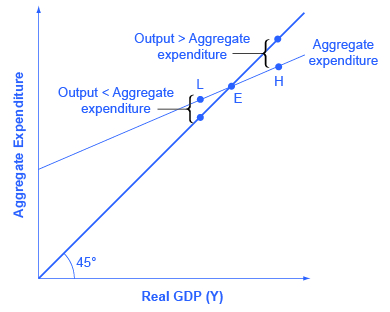
Conversely, consider the situation where the level of output is at point L—where real output is lower than the equilibrium. In that case, the level of aggregate demand in the economy is above the 45-degree line, indicating that the level of aggregate expenditure in the economy is greater than the level of output. When the level of aggregate demand has emptied the store shelves, it cannot be sustained, either. Firms will respond by increasing their level of production. Thus, the equilibrium must be the point where the amount produced and the amount spent are in balance, at the intersection of the aggregate expenditure function and the 45-degree line.

Questions & Answers

what does mean opportunity cost?
Aster Reply
what is poetive effect of population growth
Solomon Reply
what is inflation
Nasir Reply
what is demand
Eleni
what is economics
IMLAN Reply
economics theory describes individual behavior as the result of a process of optimization under constraints the objective to be reached being determined by
Kalkidan
Economics is a branch of social science that deal with How to wise use of resource ,s
Kassie
need
WARKISA
Economic Needs: In economics, needs are goods or services that are necessary for maintaining a certain standard of living. This includes things like healthcare, education, and transportation.
Kalkidan
What is demand and supply
EMPEROR Reply
deman means?
Alex
what is supply?
Alex
ex play supply?
Alex
Money market is a branch or segment of financial market where short-term debt instruments are traded upon. The instruments in this market includes Treasury bills, Bonds, Commercial Papers, Call money among other.
murana Reply
good
Kayode
what is money market
umar Reply
Examine the distinction between theory of comparative cost Advantage and theory of factor proportion
Fatima Reply
What is inflation
Bright Reply
a general and ongoing rise in the level of prices in an economy
AI-Robot
What are the factors that affect demand for a commodity
Florence Reply
price
Kenu
differentiate between demand and supply giving examples
Lambiv Reply
differentiated between demand and supply using examples
Lambiv
what is labour ?
Lambiv
how will I do?
Venny Reply
how is the graph works?I don't fully understand
Rezat Reply
information
Eliyee
devaluation
Eliyee
t
WARKISA
hi guys good evening to all
Lambiv
multiple choice question
Aster Reply
appreciation
Eliyee
explain perfect market
Lindiwe Reply
In economics, a perfect market refers to a theoretical construct where all participants have perfect information, goods are homogenous, there are no barriers to entry or exit, and prices are determined solely by supply and demand. It's an idealized model used for analysis,
Ezea

Get Jobilize Job Search Mobile App in your pocket Now!

Get it on Google Play Download on the App Store Now


Source:  OpenStax, Principles of economics. OpenStax CNX. Sep 19, 2014 Download for free at http://legacy.cnx.org/content/col11613/1.11
Google Play and the Google Play logo are trademarks of Google Inc.

Notification Switch

Would you like to follow the 'Principles of economics' conversation and receive update notifications?

Ask