

| << Chapter < Page | Chapter >> Page > |
The formula for marginal revenue is:
| Price | Quantity | Total Revenue | Marginal Revenue |
|---|---|---|---|
| $4 | 1 | $4 | - |
| $4 | 2 | $8 | $4 |
| $4 | 3 | $12 | $4 |
| $4 | 4 | $16 | $4 |
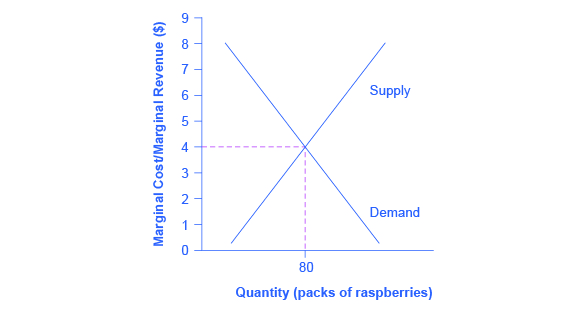
Notice that marginal revenue does not change as the firm produces more output. That is because the price is determined by supply and demand and does not change as the farmer produces more (keeping in mind that, due to the relative small size of each firm, increasing their supply has no impact on the total market supply where price is determined).
Since a perfectly competitive firm is a price taker, it can sell whatever quantity it wishes at the market-determined price. Marginal cost, the cost per additional unit sold, is calculated by dividing the change in total cost by the change in quantity. The formula for marginal cost is:
Ordinarily, marginal cost changes as the firm produces a greater quantity.
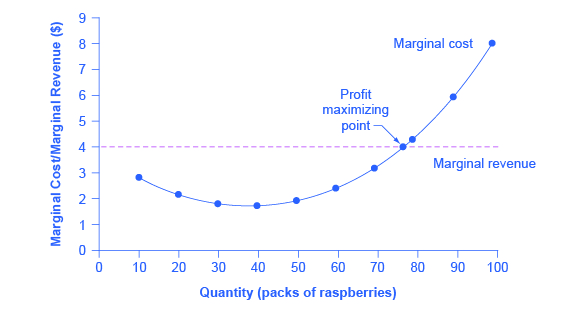
In the raspberry farm example, shown in [link] , [link] and [link] , marginal cost at first declines as production increases from 10 to 20 to 30 packs of raspberries—which represents the area of increasing marginal returns that is not uncommon at low levels of production. But then marginal costs start to increase, displaying the typical pattern of diminishing marginal returns. If the firm is producing at a quantity where MR>MC, like 40 or 50 packs of raspberries, then it can increase profit by increasing output because the marginal revenue is exceeding the marginal cost. If the firm is producing at a quantity where MC>MR, like 90 or 100 packs, then it can increase profit by reducing output because the reductions in marginal cost will exceed the reductions in marginal revenue. The firm’s profit-maximizing choice of output will occur where MR = MC (or at a choice close to that point). You will notice that what occurs on the production side is exemplified on the cost side. This is referred to as duality.
| Quantity | Total Cost | Fixed Cost | Variable Cost | Marginal Cost | Total Revenue | Marginal Revenue |
|---|---|---|---|---|---|---|
| 0 | $62 | $62 | - | - | - | - |
| 10 | $90 | $62 | $28 | $2.80 | $40 | $4.00 |
| 20 | $110 | $62 | $48 | $2.00 | $80 | $4.00 |
| 30 | $126 | $62 | $64 | $1.60 | $120 | $4.00 |
| 40 | $144 | $62 | $82 | $1.80 | $160 | $4.00 |
| 50 | $166 | $62 | $104 | $2.20 | $200 | $4.00 |
| 60 | $192 | $62 | $130 | $2.60 | $240 | $4.00 |
| 70 | $224 | $62 | $162 | $3.20 | $280 | $4.00 |
| 80 | $264 | $62 | $202 | $4.00 | $320 | $4.00 |
| 90 | $324 | $62 | $262 | $6.00 | $360 | $4.00 |
| 100 | $404 | $62 | $342 | $8.00 | $400 | $4.00 |
Notification Switch
Would you like to follow the 'Principles of economics' conversation and receive update notifications?

|
|
|
|
|

|
|

|
|

|
|

|
|

|
|

|
|

|
|

|
|

|
|

|