<< Chapter < Page Chapter >> Page >

Economists use a vocabulary of maximizing utility to describe people’s preferences. In Consumer Choices , the level of utility that a person receives is described in numerical terms. This appendix presents an alternative approach to describing personal preferences, called indifference curves, which avoids any need for using numbers to measure utility. By setting aside the assumption of putting a numerical valuation on utility—an assumption that many students and economists find uncomfortably unrealistic—the indifference curve framework helps to clarify the logic of the underlying model.

What is an indifference curve?

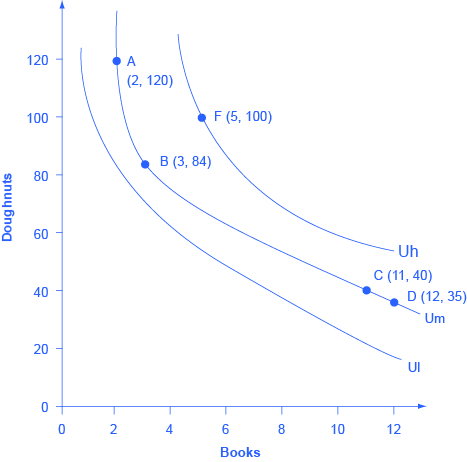
People cannot really put a numerical value on their level of satisfaction. However, they can, and do, identify what choices would give them more, or less, or the same amount of satisfaction. An indifference curve shows combinations of goods that provide an equal level of utility or satisfaction. For example, [link] presents three indifference curves that represent Lilly’s preferences for the tradeoffs that she faces in her two main relaxation activities: eating doughnuts and reading paperback books. Each indifference curve (Ul, Um, and Uh) represents one level of utility. First we will explore the meaning of one particular indifference curve and then we will look at the indifference curves as a group.

Lilly’s indifference curves

The graph shows three indifference curves. The x-axis is labeled “books” and the y-axis is labeled “doughnuts.” Curve Ul has no marked points. Um has the following marked points: A (2,120); B (3,84); C (11, 40); D (12, 35). Uh has point F (5,100) marked.
Lilly would receive equal utility from all points on a given indifference curve. Any points on the highest indifference curve Uh, like F, provide greater utility than any points like A, B, C, and D on the middle indifference curve Um. Similarly, any points on the middle indifference curve Um provide greater utility than any points on the lowest indifference curve Ul.

The Shape of an Indifference Curve

The indifference curve Um has four points labeled on it: A, B, C, and D. Since an indifference curve represents a set of choices that have the same level of utility, Lilly must receive an equal amount of utility, judged according to her personal preferences, from two books and 120 doughnuts (point A), from three books and 84 doughnuts (point B) from 11 books and 40 doughnuts (point C) or from 12 books and 35 doughnuts (point D). She would also receive the same utility from any of the unlabeled intermediate points along this indifference curve.

Indifference curves have a roughly similar shape in two ways: 1) they are downward sloping from left to right; 2) they are convex with respect to the origin. In other words, they are steeper on the left and flatter on the right. The downward slope of the indifference curve means that Lilly must trade off less of one good to get more of the other, while holding utility constant. For example, points A and B sit on the same indifference curve Um, which means that they provide Lilly with the same level of utility. Thus, the marginal utility that Lilly would gain from, say, increasing her consumption of books from two to three must be equal to the marginal utility that she would lose if her consumption of doughnuts was cut from 120 to 84—so that her overall utility remains unchanged between points A and B. Indeed, the slope along an indifference curve is referred to as the marginal rate of substitution , which is the rate at which a person is willing to trade one good for another so that utility will remain the same.

Questions & Answers

how do you get the 2/50
Abba Reply
number of sport play by 50 student construct discrete data
Aminu Reply
width of the frangebany leaves on how to write a introduction
Theresa Reply
Solve the mean of variance
Veronica Reply
Step 1: Find the mean. To find the mean, add up all the scores, then divide them by the number of scores. ... Step 2: Find each score's deviation from the mean. ... Step 3: Square each deviation from the mean. ... Step 4: Find the sum of squares. ... Step 5: Divide the sum of squares by n – 1 or N.
kenneth
what is error
Yakuba Reply
Is mistake done to something
Vutshila
Hy
anas
hy
What is the life teble
anas
hy
Jibrin
statistics is the analyzing of data
Tajudeen Reply
what is statics?
Zelalem Reply
how do you calculate mean
Gloria Reply
diveving the sum if all values
Shaynaynay
let A1,A2 and A3 events be independent,show that (A1)^c, (A2)^c and (A3)^c are independent?
Fisaye Reply
what is statistics
Akhisani Reply
data collected all over the world
Shaynaynay
construct a less than and more than table
Imad Reply
The sample of 16 students is taken. The average age in the sample was 22 years with astandard deviation of 6 years. Construct a 95% confidence interval for the age of the population.
Aschalew Reply
Bhartdarshan' is an internet-based travel agency wherein customer can see videos of the cities they plant to visit. The number of hits daily is a normally distributed random variable with a mean of 10,000 and a standard deviation of 2,400 a. what is the probability of getting more than 12,000 hits? b. what is the probability of getting fewer than 9,000 hits?
Akshay Reply
Bhartdarshan'is an internet-based travel agency wherein customer can see videos of the cities they plan to visit. The number of hits daily is a normally distributed random variable with a mean of 10,000 and a standard deviation of 2,400. a. What is the probability of getting more than 12,000 hits
Akshay
1
Bright
Sorry i want to learn more about this question
Bright
Someone help
Bright
a= 0.20233 b=0.3384
Sufiyan
a
Shaynaynay
How do I interpret level of significance?
Mohd Reply
It depends on your business problem or in Machine Learning you could use ROC- AUC cruve to decide the threshold value
Shivam
how skewness and kurtosis are used in statistics
Owen Reply
yes what is it
Taneeya
Got questions? Join the online conversation and get instant answers!
Jobilize.com Reply

Get Jobilize Job Search Mobile App in your pocket Now!

Get it on Google Play Download on the App Store Now


Source:  OpenStax, Microeconomics. OpenStax CNX. Aug 03, 2014 Download for free at http://legacy.cnx.org/content/col11627/1.10
Google Play and the Google Play logo are trademarks of Google Inc.

Notification Switch

Would you like to follow the 'Microeconomics' conversation and receive update notifications?

Ask