<< Chapter < Page
  Digital signal processing - dsp     Page 3 / 27
Chapter >> Page >

Preview

The four classes that I will present and explain in this module are designed to make it easy for you to plot and examine large quantities of data.

Sample output for PlotALot01 class

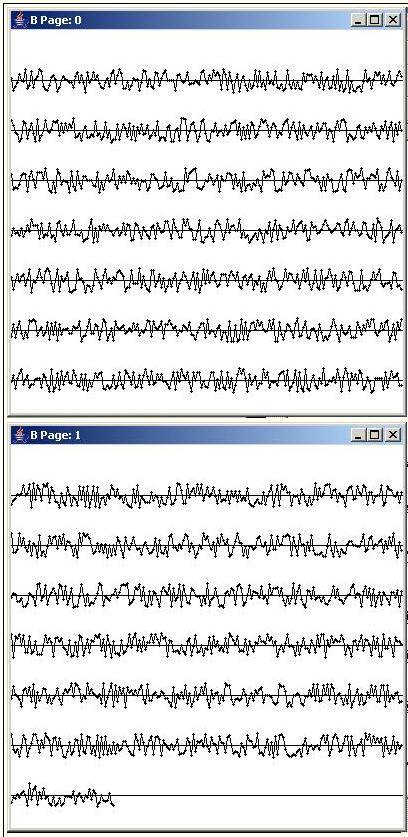
The first class named PlotALot01 is designed for the plotting of large quantities of single-channel data. Figure 1 shows an example of the plotted output from this class when used to plot a small amount of data.

Figure 1. Sample output for PlotALot01 class.
Missing Figure.

Usage information

To use the class named PlotALot01 to plot data, you first instantiate an object of the class, and then you feed data to it as the databecomes available within your program.

When all of the data has been fed to the plotting object, you call a method named plotData on the object. This causes the object to produce one or more pages of plotted data in a stack on the screen. The page containingthe earliest data is on the top of the stack and the page containing the latest data on the bottom of the stack.

Plotting format

The first data sample is plotted on the left end of the top trace on the top page (titled Page: 0) . Successive data values are plotted from left to right across the page. When the data for the first trace reaches the right endof the trace, the next data sample is plotted at the left end of a new trace that is created below the current trace. Hence, the chronological order of thedata is from left to right, top to bottom.

A horizontal axis is drawn for each trace. Positive data values are plotted above the axis and negative values are plotted below the axis.

On to the next page

When the bottom trace on a page is filled, a new page is created automatically. The next data sample is plotted on the left end of the top traceon the new page and the process described above is repeated until that page also become full. Then a new page is created, etc.

Nearly unlimited plotting capacity

You can cause the page size to be as large as you want up to the full size of the screen on your computer. You can create as many pages as you want and youcan place as many traces on each page as you want.

Other than the amount of memory that is available to the Java virtual machine, (and perhaps some limit on the number of Page objects allowed by the operating system) , there is almost no limit to the number of pages that can be produced and the amount of data that can be plotted.

Millions of data values plotted

I have successfully plotted two million data values in 141 full screen pages on a modest laptop computer with no difficulty whatsoever. When I pushed thattotal up to eight million data values in 563 full screen pages, the plotting process slowed down, but I was still able to display and examine the plots. Thepractical limit on my computer seems to be somewhere between two million and eight million data values.

Two sample pages

Figure 1 shows two pages that were physically removed from the stack and arranged with the page containing the earliest data above the page containingthe latest data for publication in this module.

Questions & Answers

it is the relatively stable flow of income
Chidubem Reply
what is circular flow of income
Divine Reply
branches of macroeconomics
SHEDRACK Reply
what is Flexible exchang rate?
poudel Reply
is gdp a reliable measurement of wealth
Atega Reply
introduction to econometrics
Husseini Reply
Hi
mostafa
hi
LEMLEM
hello
Sammol
hi
Mahesh
bi
Ruqayat
hi
Ruqayat
Hi fellas
Nyawa
hey
Sammol
hi
God
hello
Jahara
Good morning
Jorge
hi
abubakar
hi
Nmesoma
hi
Mahesh
Hi
Tom
Why is unemployment rate never zero at full employment?
Priyanka Reply
bcoz of existence of frictional unemployment in our economy.
Umashankar
what is flexible exchang rate?
poudel
due to existence of the pple with disabilities
Abdulraufu
the demand of a good rises, causing the demand for another good to fall
Rushawn Reply
is it possible to leave every good at the same level
Joseph
I don't think so. because check it, if the demand for chicken increases, people will no longer consume fish like they used to causing a fall in the demand for fish
Anuolu
is not really possible to let the value of a goods to be same at the same time.....
Salome
Suppose the inflation rate is 6%, does it mean that all the goods you purchase will cost 6% more than previous year? Provide with reasoning.
Geetha Reply
Not necessarily. To measure the inflation rate economists normally use an averaged price index of a basket of certain goods. So if you purchase goods included in the basket, you will notice that you pay 6% more, otherwise not necessarily.
Waeth
discus major problems of macroeconomics
Alii Reply
what is the problem of macroeconomics
Yoal
Economic growth Stable prices and low unemployment
Ephraim
explain inflationcause and itis degre
Miresa Reply
what is inflation
Getu
increase in general price levels
WEETO
Good day How do I calculate this question: C= 100+5yd G= 2000 T= 2000 I(planned)=200. Suppose the actual output is 3000. What is the level of planned expenditures at this level of output?
Chisomo Reply
how to calculate actual output?
Chisomo
how to calculate the equilibrium income
Beshir
Criteria for determining money supply
Thapase Reply
who we can define macroeconomics in one line
Muhammad
Aggregate demand
Mohammed
C=k100 +9y and i=k50.calculate the equilibrium level of output
Mercy Reply
Hi
Isiaka
Hi
Geli
hy
Man
👋
Bahunda
hy how are you?
Man
ys
Amisha
how are you guys
Sekou
f9 guys
Amisha
how are you guys
Sekou
ys am also fine
Amisha
fine and you guys
Geli
from Nepal
Amisha
nawalparasi district from belatari
Amisha
nd u
Amisha
I am Camara from Guinea west Africa... happy to meet you guys here
Sekou
ma management ho
Amisha
ahile becheclor ho
Amisha
hjr ktm bta ho ani k kaam grnu hunxa tw
Amisha
belatari
Amisha
1st year ho
Amisha
nd u
Amisha
ahh
Amisha
kaha biratnagar
Amisha
ys
Amisha
kina k vo
Amisha
money as unit of account means what?
Kalombe
A unit of account is something that can be used to value goods and services and make calculations
Jim
all of you please speak in English I can't understand you're language
Muhammad
I want to know how can we define macroeconomics in one line
Muhammad
it must be .9 or 0.9 no Mpc is greater than 1 Y=100+.9Y+50 Y-.9Y=150 0.1Y/0.1=150/0.1 Y=1500
Kalombe
Mercy is it clear?😋
Kalombe
hi can someone help me on this question If a negative shocks shifts the IS curve to the left, what type of policy do you suggest so as to stabilize the level of output? discuss your answer using appropriate graph.
Galge Reply
if interest rate is increased this will will reduce the level of income shifting the curve to the left ◀️
Kalombe
Got questions? Join the online conversation and get instant answers!
Jobilize.com Reply

Get Jobilize Job Search Mobile App in your pocket Now!

Get it on Google Play Download on the App Store Now


Source:  OpenStax, Digital signal processing - dsp. OpenStax CNX. Jan 06, 2016 Download for free at https://legacy.cnx.org/content/col11642/1.38
Google Play and the Google Play logo are trademarks of Google Inc.

Notification Switch

Would you like to follow the 'Digital signal processing - dsp' conversation and receive update notifications?

Ask