

| << Chapter < Page | Chapter >> Page > |
***SORRY, THIS MEDIA TYPE IS NOT SUPPORTED.***
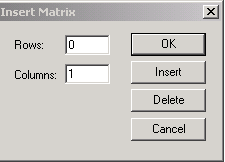
Hình.3.2. Hộp thoại Insert Matrix
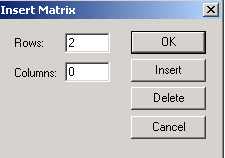
Hình 3.3
Để thêm một cột (hoặc hàng) hay nhiều cột (hoặc hàng) vào Ma trận, thực hiện như sau:
Kích vào phần tử trong cột (hoặc hàng), điểm chèn sẽ nằm bên phải (đối với cột) và bên dưới (đối với hàng).
Từ thanh Math, kích vào biểu tượng
![]() sẽ xuất hiện các lựa chọn để tính toán cho Ma trận và cả Véc tơ (hình 3.4).
sẽ xuất hiện các lựa chọn để tính toán cho Ma trận và cả Véc tơ (hình 3.4).
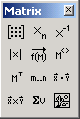
Hình 3.4
a. Subscripts (chỉ số dưới)
Xác định trị số dưới của Ma trận.
Cho Ma trận M.
Kích vào biểu tượng
![]() để xác định các chỉ số dưới.
để xác định các chỉ số dưới.
***SORRY, THIS MEDIA TYPE IS NOT SUPPORTED.******SORRY, THIS MEDIA TYPE IS NOT SUPPORTED.***
Thay đổi chỉ số dưới của Ma trận.
***SORRY, THIS MEDIA TYPE IS NOT SUPPORTED.***
***SORRY, THIS MEDIA TYPE IS NOT SUPPORTED.***
c. Tính định thức của Ma trận (Determinant)
***SORRY, THIS MEDIA TYPE IS NOT SUPPORTED.***
d. Trích một cột từ một Ma trận (Matrix column)
***SORRY, THIS MEDIA TYPE IS NOT SUPPORTED.***
đ. Ma trận chuyển vị (Matrix transpose)
***SORRY, THIS MEDIA TYPE IS NOT SUPPORTED.***
Hàm stack (A,B,C…) dùng để nối hai hay nhiều Ma trận với nhau theo hướng từ trên xuống dưới.
Hàm augment (A,B,C…) dùng để nối hai hay nhiều Ma trận với nhau theo hướng từ trái qua phải.
Ví dụ:
***SORRY, THIS MEDIA TYPE IS NOT SUPPORTED.***
***SORRY, THIS MEDIA TYPE IS NOT SUPPORTED.***
***SORRY, THIS MEDIA TYPE IS NOT SUPPORTED.***
Trong đó:
Ví dụ:
***SORRY, THIS MEDIA TYPE IS NOT SUPPORTED.***
Ví dụ:
***SORRY, THIS MEDIA TYPE IS NOT SUPPORTED.***
Ví dụ:
***SORRY, THIS MEDIA TYPE IS NOT SUPPORTED.***
Trong đó:
- m là số dòng của Ma trận.
- n là số cột của Ma trận.
- f là hàm số của hai biến.
Ví dụ:
***SORRY, THIS MEDIA TYPE IS NOT SUPPORTED.***
Trong đó:
- z là giá trị của phần tử thuộc cột (hoặc hàng) đầu tiên.
- M, N là Ma trận.
- c, r là giá trị phần tử được trả về từ cột (hoặc hàng) tương ứng.
Ví dụ:
***SORRY, THIS MEDIA TYPE IS NOT SUPPORTED.***
Kết quả khi xử lý số liệu Ma trận thường được thể hiện theo hai dạng sau:
- Nếu mảng có ít hơn 100 phần tử, kết quả được hiển thị dưới dạng Ma trận thông thường.
- Nếu mảng có nhiều hơn 100 phần tử, kết quả được hiển thị dưới dạng bảng có thanh trượt, kích vào thanh trượt để xem những phần tử bị che khuất.
Tuy nhiên nếu muốn thể hiện kết quả dưới dạng bảng trong trường hợp có ít hơn 100 phần tử, thực hiện như sau:
Từ thanh menu: chọn Format/Result, xuất hiện hộp thoại Result Format (hình 3.5).
Chọn thẻ
![]() .
.
Tại mục Matrix display style chọn “Table”.
Chọn OK.
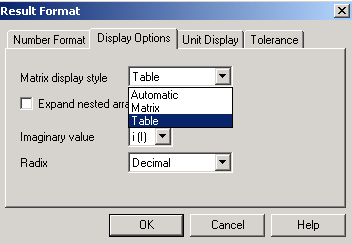
Hình 3.5. Hộp thoại Result Format
Ví dụ:
***SORRY, THIS MEDIA TYPE IS NOT SUPPORTED.***
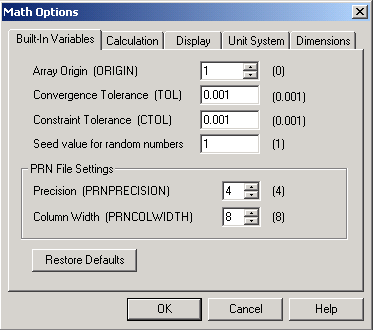
Hình 3.6. Math Options
Trong một Véc tơ hay Ma trận, phần tử đầu tiên trong Mathcad được bắt đầu bằng phần tử “0”. Ðể phần tử đầu tiên bắt đầu là “1” thực hiện theo cách sau:
Từ thanh công cụ: chọn Math/Options, xuất hiện hộp thoại Math Options (hình 3.6).
Chọn thẻ Built-In Variables.
Trong mục Text box Array Origin (ORIGIN) chọn số “1”.
Chọn OK.
BÀI TẬP CHƯƠNG 4
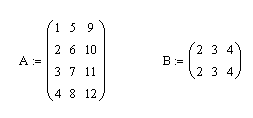
1. Cho ma trận A và B như sau:

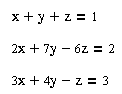
2. Giải hệ phương trình tuyến tính đưa về dạng Ma trận
a.
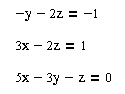
b.
Notification Switch
Would you like to follow the 'Bài giảng môn học mathcad' conversation and receive update notifications?

|
|

|
|

|
|

|
|

|
|

|
|

|
|

|
|

|
|
|
|