<< Chapter < Page Chapter >> Page >
Converting between a signal and numbers.

Analog-to-digital conversion

Because of the way computers are organized, signal must be represented by a finite number of bytes. This restrictionmeans that both the time axis and the amplitude axis must be quantized : They must each be a multiple of the integers. We assume that we do not use floating-point A/D converters. Quite surprisingly, the Sampling Theorem allows us to quantizethe time axis without error for some signals. The signals that can be sampled without introducingerror are interesting, and as described in the next section, we can make a signal "samplable" by filtering. In contrast,no one has found a way of performing the amplitude quantization step without introducing an unrecoverable error.Thus, a signal's value can no longer be any real number. Signals processed by digital computers must be discrete-valued : their values must be proportional to the integers. Consequently, analog-to-digital conversion introduces error .

The sampling theorem

Digital transmission of information and digital signal processing all require signals to first be "acquired" by acomputer. One of the most amazing and useful results in electrical engineering is that signals can be converted from afunction of time into a sequence of numbers without error : We can convert the numbers back into the signal with (theoretically) no error. Harold Nyquist, a Bell Laboratories engineer, first derived this result, known as the Sampling Theorem, in the1920s. It found no real application back then. Claude Shannon , also at Bell Laboratories, revived the result once computerswere made public after World War II.

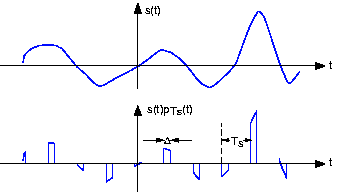
The sampled version of the analog signal s t is s n T s , with T s known as the sampling interval . Clearly, the value of the original signal at the sampling times ispreserved; the issue is how the signal values between the samples can be reconstructed since they are lost in the samplingprocess. To characterize sampling, we approximate it as the product x t s t P T s t , with P T s t being the periodic pulse signal. The resulting signal, as shown in [link] , has nonzero values only during the time intervals n T s Δ 2 n T s Δ 2 , n -1 0 1 .

Sampled signal

The waveform of an example signal is shown in the top plot and its sampled version in the bottom.
For our purposes here, we center the periodic pulse signal about the origin so that its Fourier series coefficients arereal (the signal is even).
p T s t k c k 2 k t T s
c k k Δ T s k
If the properties of s t and the periodic pulse signal are chosen properly, we can recover s t from x t by filtering.

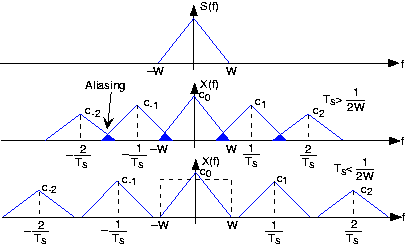
To understand how signal values between the samples can be "filled" in, we need to calculate the sampled signal'sspectrum. Using the Fourier series representation of the periodic sampling signal,

x t k c k 2 k t T s s t
Considering each term in the sum separately, we need to know the spectrum of the product of the complex exponential and thesignal. Evaluating this transform directly is quite easy.
t s t 2 k t T s 2 f t t s t 2 f k T s t S f k T s
Thus, the spectrum of the sampled signal consists of weighted (by the coefficients c k ) and delayed versions of the signal's spectrum( [link] ).
X f k c k S f k T s
In general, the terms in this sum overlap each other in thefrequency domain, rendering recovery of the original signal impossible. This unpleasant phenomenon is known as aliasing .

Aliasing

The spectrum of some bandlimited (to W Hz) signal is shown in the top plot. If the sampling interval T s is chosen too large relative to the bandwidth W , aliasing will occur. In the bottom plot, the samplinginterval is chosen sufficiently small to avoid aliasing. Note that if the signal were not bandlimited, thecomponent spectra would always overlap.
If, however, we satisfy two conditions:
  • The signal s t is bandlimited —has power in a restricted frequency range—to W Hz, and
  • the sampling interval T s is small enough so that the individual components in thesum do not overlap— T s 1 2 W ,
aliasing will not occur. In this delightful case, we can recover the original signal by lowpass filtering x t with a filter having a cutoff frequency equal to W Hz. These two conditions ensure the ability to recover abandlimited signal from its sampled version: We thus have the Sampling Theorem .

The Sampling Theorem (as stated) does not mention the pulse width Δ . What is the effect of this parameter on our ability torecover a signal from its samples (assuming the Sampling Theorem's two conditions are met)?

The only effect of pulse duration is to unequally weight the spectral repetitions. Because we are only concernedwith the repetition centered about the origin, the pulse duration has no significant effect on recovering a signalfrom its samples.

The frequency 1 2 T s , known today as the Nyquist frequency and the Shannon sampling frequency , corresponds to the highest frequency at which a signal can contain energy andremain compatible with the Sampling Theorem. High-quality sampling systems ensure that no aliasing occurs byunceremoniously lowpass filtering the signal (cutoff frequency being slightly lower than the Nyquist frequency) beforesampling. Such systems therefore vary the anti-aliasing filter's cutoff frequency as the sampling rate varies. Because such quality featurescost money, many sound cards do not have anti-aliasing filters or, for that matter, post-samplingfilters. They sample at high frequencies, 44.1 kHz for example, and hope the signal contains no frequencies above theNyquist frequency (22.05 kHz in our example). If, however, the signal contains frequencies beyond the sound card's Nyquistfrequency, the resulting aliasing can be impossible to remove.

To gain a better appreciation of aliasing, sketch the spectrum of a sampled square wave. For simplicityconsider only the spectral repetitions centered at 1 T s , 0 , 1 T s . Let the sampling interval T s be 1; consider two values for the square wave's period:3.5 and 4. Note in particular where the spectral lines go as the period decreases; some will move to the left andsome to the right. What property characterizes the ones going the same direction?

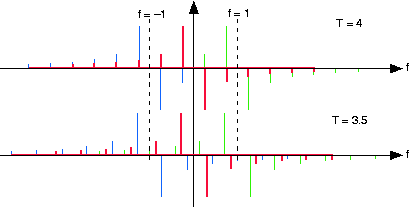
The square wave's spectrum is shown by the bolder set of lines centered about the origin. The dashed linescorrespond to the frequencies about which the spectral repetitions (due to sampling with T s 1 ) occur. As the square wave's period decreases, the negativefrequency lines move to the left and the positive frequency ones to the right.

If we satisfy the Sampling Theorem's conditions, the signalwill change only slightly during each pulse. As we narrow the pulse, making Δ smaller and smaller, the nonzero values of the signal s t p T s t will simply be s n T s , the signal's samples . If indeed the Nyquist frequency equals the signal's highest frequency, at least twosamples will occur within the period of the signal's highest frequency sinusoid. In these ways, the sampling signalcaptures the sampled signal's temporal variations in a way that leaves all the original signal's structure intact.

What is the simplest bandlimited signal? Using this signal, convince yourself that less than twosamples/period will not suffice to specify it. If the sampling rate 1 T s is not high enough, what signal would your resulting undersampled signal become?

The simplest bandlimited signal is the sine wave. At theNyquist frequency, exactly two samples/period would occur. Reducing the sampling rate would result in fewersamples/period, and these samples would appear to have arisen from a lower frequency sinusoid.

Questions & Answers

What are the factors that affect demand for a commodity
Florence Reply
differentiate between demand and supply giving examples
Lambiv Reply
differentiated between demand and supply using examples
Lambiv
what is labour ?
Lambiv
how will I do?
Venny Reply
how is the graph works?I don't fully understand
Rezat Reply
information
Eliyee
devaluation
Eliyee
t
WARKISA
hi guys good evening to all
Lambiv
multiple choice question
Aster Reply
appreciation
Eliyee
explain perfect market
Lindiwe Reply
In economics, a perfect market refers to a theoretical construct where all participants have perfect information, goods are homogenous, there are no barriers to entry or exit, and prices are determined solely by supply and demand. It's an idealized model used for analysis,
Ezea
What is ceteris paribus?
Shukri Reply
other things being equal
AI-Robot
When MP₁ becomes negative, TP start to decline. Extuples Suppose that the short-run production function of certain cut-flower firm is given by: Q=4KL-0.6K2 - 0.112 • Where is quantity of cut flower produced, I is labour input and K is fixed capital input (K-5). Determine the average product of lab
Kelo
Extuples Suppose that the short-run production function of certain cut-flower firm is given by: Q=4KL-0.6K2 - 0.112 • Where is quantity of cut flower produced, I is labour input and K is fixed capital input (K-5). Determine the average product of labour (APL) and marginal product of labour (MPL)
Kelo
yes,thank you
Shukri
Can I ask you other question?
Shukri
what is monopoly mean?
Habtamu Reply
What is different between quantity demand and demand?
Shukri Reply
Quantity demanded refers to the specific amount of a good or service that consumers are willing and able to purchase at a give price and within a specific time period. Demand, on the other hand, is a broader concept that encompasses the entire relationship between price and quantity demanded
Ezea
ok
Shukri
how do you save a country economic situation when it's falling apart
Lilia Reply
what is the difference between economic growth and development
Fiker Reply
Economic growth as an increase in the production and consumption of goods and services within an economy.but Economic development as a broader concept that encompasses not only economic growth but also social & human well being.
Shukri
production function means
Jabir
What do you think is more important to focus on when considering inequality ?
Abdisa Reply
any question about economics?
Awais Reply
sir...I just want to ask one question... Define the term contract curve? if you are free please help me to find this answer 🙏
Asui
it is a curve that we get after connecting the pareto optimal combinations of two consumers after their mutually beneficial trade offs
Awais
thank you so much 👍 sir
Asui
In economics, the contract curve refers to the set of points in an Edgeworth box diagram where both parties involved in a trade cannot be made better off without making one of them worse off. It represents the Pareto efficient allocations of goods between two individuals or entities, where neither p
Cornelius
In economics, the contract curve refers to the set of points in an Edgeworth box diagram where both parties involved in a trade cannot be made better off without making one of them worse off. It represents the Pareto efficient allocations of goods between two individuals or entities,
Cornelius
Suppose a consumer consuming two commodities X and Y has The following utility function u=X0.4 Y0.6. If the price of the X and Y are 2 and 3 respectively and income Constraint is birr 50. A,Calculate quantities of x and y which maximize utility. B,Calculate value of Lagrange multiplier. C,Calculate quantities of X and Y consumed with a given price. D,alculate optimum level of output .
Feyisa Reply
Answer
Feyisa
c
Jabir
the market for lemon has 10 potential consumers, each having an individual demand curve p=101-10Qi, where p is price in dollar's per cup and Qi is the number of cups demanded per week by the i th consumer.Find the market demand curve using algebra. Draw an individual demand curve and the market dema
Gsbwnw Reply
suppose the production function is given by ( L, K)=L¼K¾.assuming capital is fixed find APL and MPL. consider the following short run production function:Q=6L²-0.4L³ a) find the value of L that maximizes output b)find the value of L that maximizes marginal product
Abdureman
Got questions? Join the online conversation and get instant answers!
Jobilize.com Reply

Get Jobilize Job Search Mobile App in your pocket Now!

Get it on Google Play Download on the App Store Now


Source:  OpenStax, Analog-to-digital conversion. OpenStax CNX. Sep 20, 2008 Download for free at http://cnx.org/content/col10578/1.2
Google Play and the Google Play logo are trademarks of Google Inc.

Notification Switch

Would you like to follow the 'Analog-to-digital conversion' conversation and receive update notifications?

Ask