<< Chapter < Page Chapter >> Page >
Helps the user understand the various components in NFC and their mathematical significance. Very useful for discussions presented in the next module.

About the components

An NFC system consists of a passive network (the card/circuit with information) and an active circuit. We must also take into account the environment surrounding the device. A working knowledge of these three componenents is essential to understanding the inner mechanics of near field communication.

The active circuit

The active circuit has a transmitting antenna that broadcasts RF waves and a number of electrodes that read values corresponding to how the environment reacts to the RF waves. All the processing power is centered in this active circuit and that is where the decoding will take place. This would be considered the reader in the traditional sense. In the following mathematical discussion, the electrode voltages of the active circuit will be values in a vector v1.

The passive network

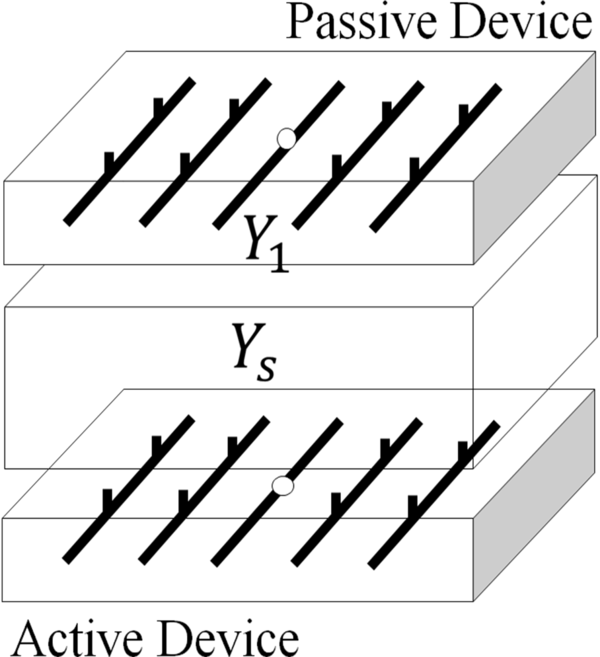
The passive network consists of a series of electrodes which are attached to impedances with values of infinity or zero (open/closed switches). This network might be located inside a phone or other device and is associated with the client side identification. The configuration of the passive network uniquely identifies the user, and thus, our problem becomes one of reverse engineering in which we try to determine the impedances. In our analysis, the passive network voltages are stored in the vector v1 and the impedances are represented by the matrix Y1. Since we are assuming no mutual impedances, this is a diagonal matrix. Rather than using infinity, we have represented the open switches with the very high impedance value of 10,000 ohms.

The environment

The “evil channel” is our environment. It converts our beautiful binary impedances into ugly complex voltages. It is our job to understand its effects and make sure that our output is decipherable. The channel matrix we used was given to us and was measured experimentally. It can be modeled by a large square matrix which is of size N x N where N is the total number of voltages (in this case 41). The matrix is labeled Ys and is divided into 9 separate matrices, each representing the mutual interaction of different elements in our matrix.

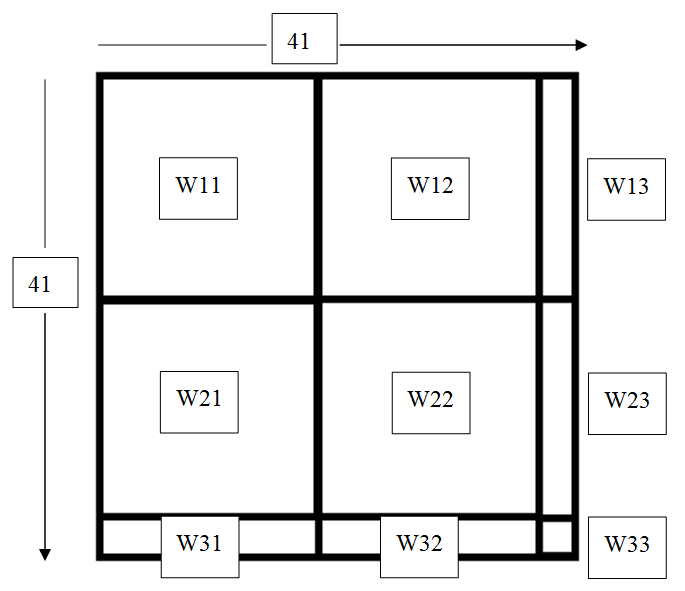
For example, the elements in matrix W12 would reperesent how the electrodes with voltages v1 interact with the electrodes with voltages v2. Consequently, our answer lies in simplifying this matrix and trying to nullify it’s effect on the input (the Y1 matrix).

Problem analysis

As previously stated, the relationship between input impedences and output voltages is non-linear by nature. Thus, our task will be to find some underlying patterns between input and output so that we may adequately decode the voltage values. When presented with a problem as open-ended as this, a number of techniques can be employed. We must make a preliminary analysis of the data through the use of well-constructed plots and principle component analysis.

Questions & Answers

differentiate between demand and supply giving examples
Lambiv Reply
differentiated between demand and supply using examples
Lambiv
what is labour ?
Lambiv
how will I do?
Venny Reply
how is the graph works?I don't fully understand
Rezat Reply
information
Eliyee
devaluation
Eliyee
t
WARKISA
hi guys good evening to all
Lambiv
multiple choice question
Aster Reply
appreciation
Eliyee
explain perfect market
Lindiwe Reply
In economics, a perfect market refers to a theoretical construct where all participants have perfect information, goods are homogenous, there are no barriers to entry or exit, and prices are determined solely by supply and demand. It's an idealized model used for analysis,
Ezea
What is ceteris paribus?
Shukri Reply
other things being equal
AI-Robot
When MP₁ becomes negative, TP start to decline. Extuples Suppose that the short-run production function of certain cut-flower firm is given by: Q=4KL-0.6K2 - 0.112 • Where is quantity of cut flower produced, I is labour input and K is fixed capital input (K-5). Determine the average product of lab
Kelo
Extuples Suppose that the short-run production function of certain cut-flower firm is given by: Q=4KL-0.6K2 - 0.112 • Where is quantity of cut flower produced, I is labour input and K is fixed capital input (K-5). Determine the average product of labour (APL) and marginal product of labour (MPL)
Kelo
yes,thank you
Shukri
Can I ask you other question?
Shukri
what is monopoly mean?
Habtamu Reply
What is different between quantity demand and demand?
Shukri Reply
Quantity demanded refers to the specific amount of a good or service that consumers are willing and able to purchase at a give price and within a specific time period. Demand, on the other hand, is a broader concept that encompasses the entire relationship between price and quantity demanded
Ezea
ok
Shukri
how do you save a country economic situation when it's falling apart
Lilia Reply
what is the difference between economic growth and development
Fiker Reply
Economic growth as an increase in the production and consumption of goods and services within an economy.but Economic development as a broader concept that encompasses not only economic growth but also social & human well being.
Shukri
production function means
Jabir
What do you think is more important to focus on when considering inequality ?
Abdisa Reply
any question about economics?
Awais Reply
sir...I just want to ask one question... Define the term contract curve? if you are free please help me to find this answer 🙏
Asui
it is a curve that we get after connecting the pareto optimal combinations of two consumers after their mutually beneficial trade offs
Awais
thank you so much 👍 sir
Asui
In economics, the contract curve refers to the set of points in an Edgeworth box diagram where both parties involved in a trade cannot be made better off without making one of them worse off. It represents the Pareto efficient allocations of goods between two individuals or entities, where neither p
Cornelius
In economics, the contract curve refers to the set of points in an Edgeworth box diagram where both parties involved in a trade cannot be made better off without making one of them worse off. It represents the Pareto efficient allocations of goods between two individuals or entities,
Cornelius
Suppose a consumer consuming two commodities X and Y has The following utility function u=X0.4 Y0.6. If the price of the X and Y are 2 and 3 respectively and income Constraint is birr 50. A,Calculate quantities of x and y which maximize utility. B,Calculate value of Lagrange multiplier. C,Calculate quantities of X and Y consumed with a given price. D,alculate optimum level of output .
Feyisa Reply
Answer
Feyisa
c
Jabir
the market for lemon has 10 potential consumers, each having an individual demand curve p=101-10Qi, where p is price in dollar's per cup and Qi is the number of cups demanded per week by the i th consumer.Find the market demand curve using algebra. Draw an individual demand curve and the market dema
Gsbwnw Reply
suppose the production function is given by ( L, K)=L¼K¾.assuming capital is fixed find APL and MPL. consider the following short run production function:Q=6L²-0.4L³ a) find the value of L that maximizes output b)find the value of L that maximizes marginal product
Abdureman
types of unemployment
Yomi Reply
What is the difference between perfect competition and monopolistic competition?
Mohammed
Got questions? Join the online conversation and get instant answers!
Jobilize.com Reply

Get Jobilize Job Search Mobile App in your pocket Now!

Get it on Google Play Download on the App Store Now


Source:  OpenStax, Near field communication simulation & Identification. OpenStax CNX. Dec 19, 2011 Download for free at http://cnx.org/content/col11398/1.1
Google Play and the Google Play logo are trademarks of Google Inc.

Notification Switch

Would you like to follow the 'Near field communication simulation & Identification' conversation and receive update notifications?

Ask